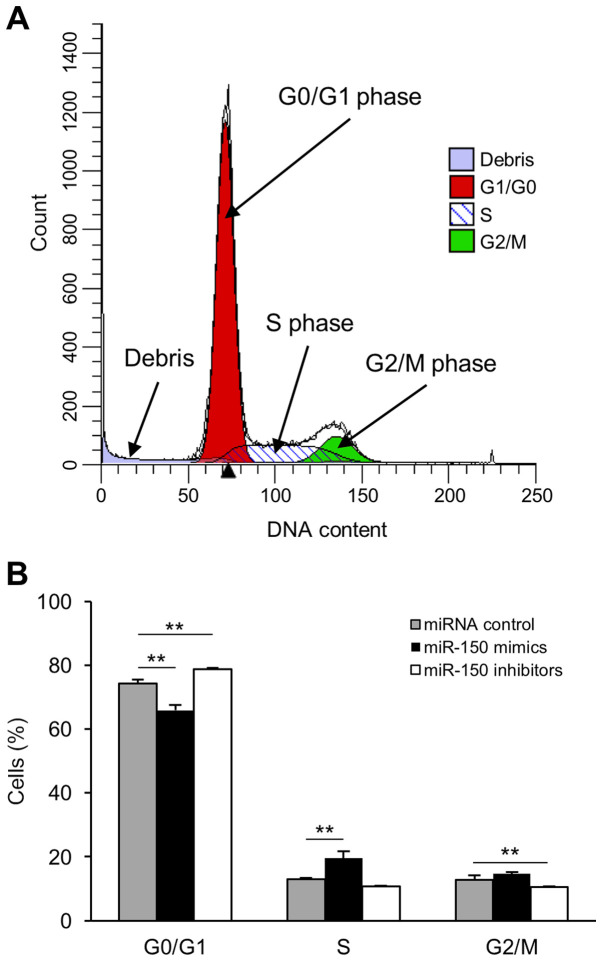
Figure 4.
miR-150 promotes cell cycle progression. HeLa cells were transfected with miR-150 mimics, miR-150 inhibitors or miRNA controls for 72 h, and the number of cells in each phase of the cell cycle was measured using a flow cytometer and determined with ModFit LT software. (A) Representative DNA content graphic profiles of the cell cycle are presented. ModFit LT program allows to scan the histogram for peaks and to determine the number of cell cycles based on the sizes and positions. Debris is excluded from cell cycle determination by ModFit LT algorithm. The X-axis shows the DNA content. The red region, diagonal line, and green area indicate the G0/G1 phase, S phase, G2/M phase, respectively. (B) The percentages of cells in different cell cycle phases were analyzed and presented as a histogram. Significant differences were assessed using Dunn's test. **P<0.01. Bars represent the mean ± standard deviation of three experiments. miR, microRNA.

