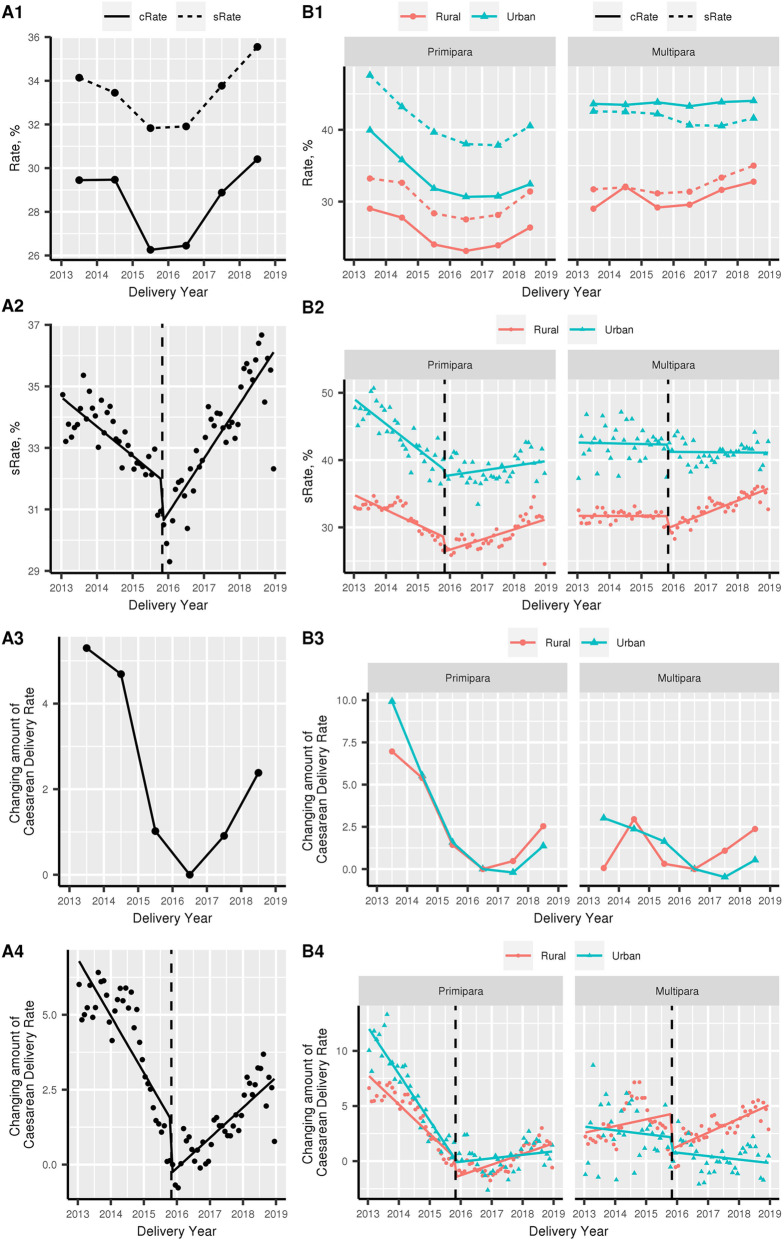
Fig. 2.
Caesarean birth rate of NFPCP participants in 2013–2018, before and after the universal two-child policy. A1 Caesarean birth rate of NFPCP participants in 2013–2018; cRate, crude rate; sRate, standardized rate. A3 After adjustment for baseline characteristics distributed differently in the study period, marginal effect results revealed the changing amount of caesarean birth rate. A2, A4 Interrupted time series (ITS) analysis to determine impacts of the universal two-child policy on the trend of caesarean birth. B1–B4 Trends of caesarean birth rate in different household register type (rural and urban) and parity (primipara and multipara)

