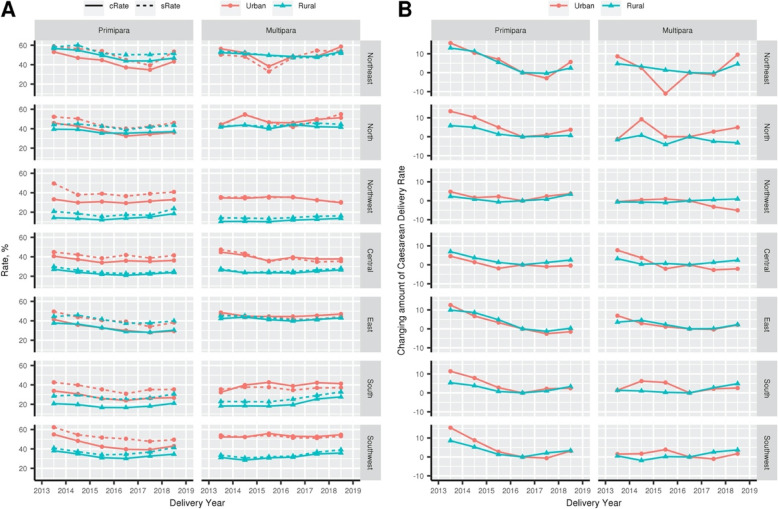
Fig. 3.
Caesarean birth rate of NFPCP participants in 2013–2018, according to participants region. a Caesarean birth rate of NFPCP participants in 2013–2018, according to participants region (cRate, crude rate; sRate, standardized rate). Participants’ region was defined according to their geographical location, including Northeastern, Northern, Northwestern, Central, Eastern, Southern, and Southwestern. b After adjustment for baseline characteristics distributed differently in the study period, marginal effect results revealed the changing amount of caesarean birth rate

