
Figure 1: Pictorial Representations of Common Machine Learning Techniques.
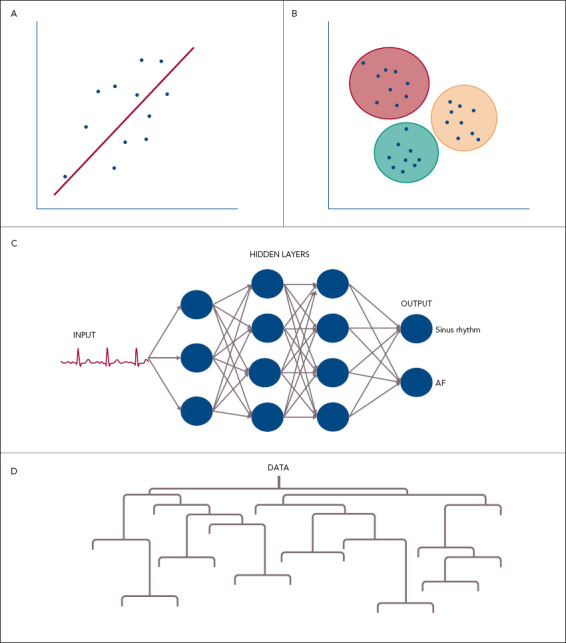
A: Linear regression where a line of best fit is estimated that allows future predictions to be made given new variables; B: Cluster analysis that separates observations into groups based on their similarity. In this case three groups have been determined; C: An artificial neural network demonstrating an input (ECG) that is fed through a number of connected nodes to match to an output (sinus rhythm); D: A decision tree diagram where values are determined at each branch until a final output is determined.