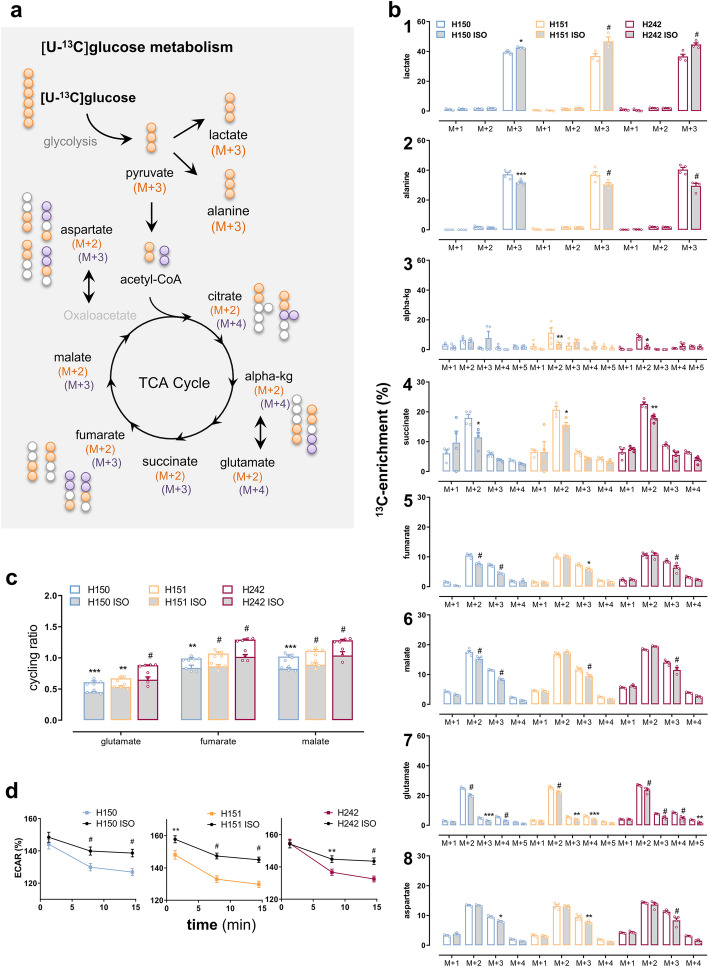
Fig. 2.
FTD3 neurons display glucose hypometabolism contrasting with increased TCA cycle activity. a Schematic representation of the main labelling patterns obtained after incubation with [U-13C] glucose and 13C-enrichment depicted as percentage labelling in metabolites from neuronal glucose metabolism. b Cultures were incubated for 90 min with [U-13C] glucose (2.5 mM) then cell extracts were collected and analysed using GC-MS for determination of the percentage distribution of 13C-labelled metabolites in CRISPR/Cas9-generated isogenic controls (grey bars) and the respective FTD3 patient cell lines (H150, H151 and H242; white bars). [U-13C] glucose is metabolized to [U-13C] pyruvate during glycolysis which can either be converted to [U-13C] alanine (alanine M + 3) or be rapidly transformed into [U-13C] lactate (lactate M + 3). In addition, pyruvate can be further metabolized in the TCA cycle, entering as [1,2-13C]Acetyl-Coenzyme A (Ac-CoA [1,2-13C]) which reacts with unlabelled oxaloacetate. Hence, double-labelled TCA cycle metabolites are produced from the first turn metabolism of [1,2-13C]Ac-CoA in the TCA cycle [18] while a second turn of the TCA cycle yields M + 4 and M + 3 labelled metabolites. Subsequent turns will give rise to complex labelling patterns and labelling in further isotopologues (M + X). Decreased labelling (%) in lactate M + 3 indicates reduced glycolytic activity while increased labelling in the TCA cycle metabolites and amino acids indicates increased TCA cycle activity, directly evaluated by calculating the cycling ratios shown in c as the ratio of % labelling in isotopologue (M + X) from every other TCA cycle turns divided by M + 2% labelling obtained from a first turn of the TCA cycle (see Methods). These showed increased TCA cycle turnover (staked white bars) in the FTD3 neurons. Data are presented as labelling (%) of M + X, where M is the mass of the unlabeled metabolite and X is the number of 13C-labeled carbon atoms. d Extracellular acidification rate as an indicator of glycolytic activity was measured in real using the XFe96 Extracellular Flux Analyzer (Seahorse Biosciences-Agilent Technologies) with glucose as substrate in isogenic controls (black lines) and FTD3 patient cell lines (color lines). ECAR is denoted as percentage of the respective non-glycolytic medium acidification values (last point taken at the end of the assay). The decrease in ECAR demonstrates diminished lactate release from hampered glycolytic activity. Results are means ± S.E.M. obtained from three different patient cell lines indicated by small circles from at least three different culture preparations of hiPSC-derived neurons. *P < 0.05 or **P < 0.001, ***P < 0.0005, # P < 0.0001, two-way ANOVA correcting for multiple comparisons was employed

