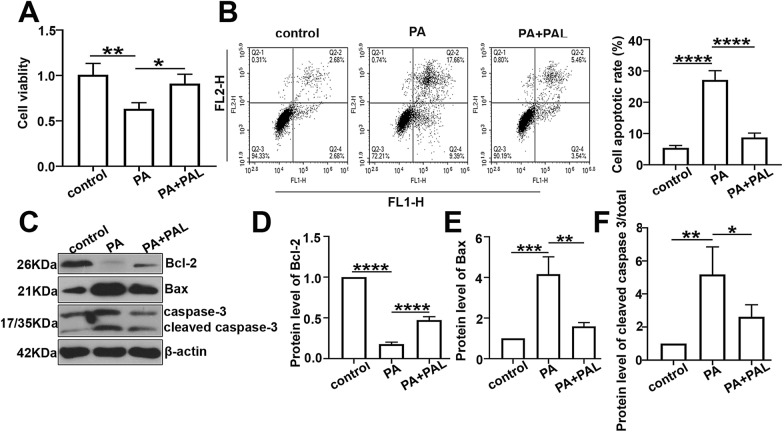
Fig. 6.
Effect of PAL on cell apoptosis in palmitate (PA) treated INS-1 cells. a The cell viability in each group determined by MTT assay. b The cell apoptotic rate assessed by flow cytometry along with quantification. c The protein levels of Bcl-2, Bax, cleaved caspase-3 and caspase-3 measured by western-blot analysis. d Quantification analysis of Bcl-2 expression level. e Quantification analysis of Bax expression level. f Quantification analysis of cleaved caspase-3/total caspase-3 expression level. Values are expressed as mean ± SD. n = 3.*P < 0.05, **P < 0.01, *** P < 0.001, **** P < 0.0001

