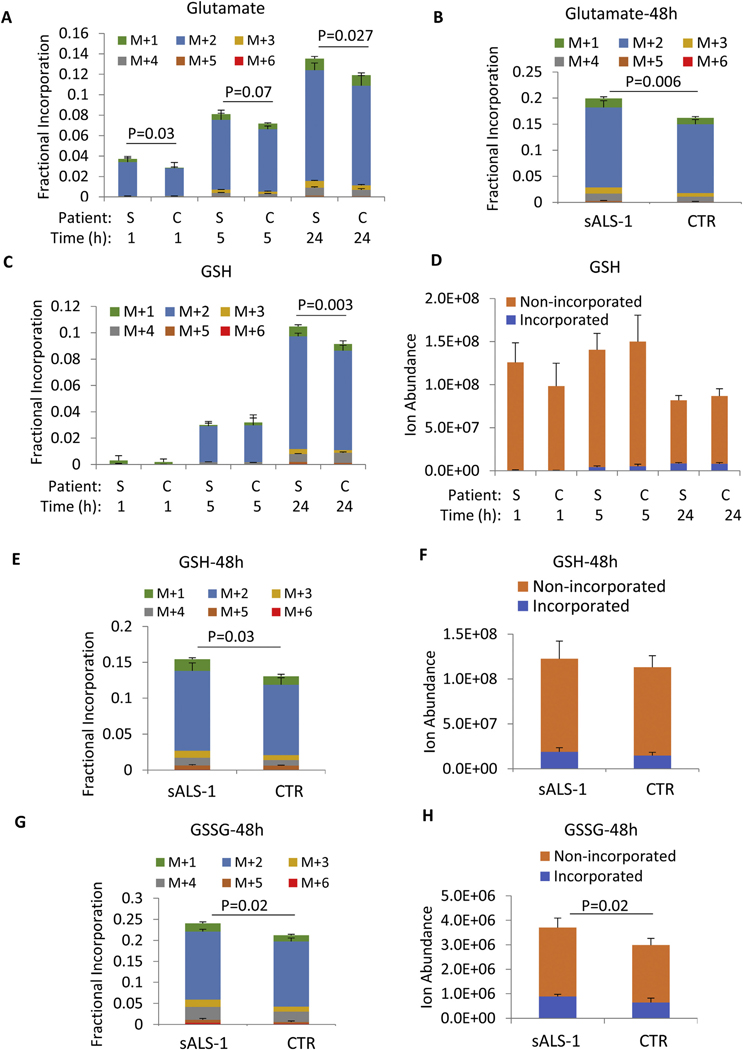
Fig. 3.
[U–13C]-glucose incorporation into GSH synthesis is increased in sALS-1. A, B, C, E, G: Glutamate, GSH and GSSG fractional incorporation after 1 h, 5 h, 24 h and 48 h of [U-13C] glucose isotope enrichment. D, F, H: incorporated and non-incorporated ion abundance of GSH and GSSG after 1 h, 5 h, 24 h and 48 h of [U-13C] glucose isotope enrichment. “S” denotes sALS-1 patients and “C” denotes controls. M + n (n = 1 to 6) refers to the number of incorporated 13C. All data represent mean ± S.D., n = 2 from 3 cell lines per group, cell lines studied were the same as those described in Fig. 2. P value was calculated from 2-tailed Student’s t-test.

