Figure 2.
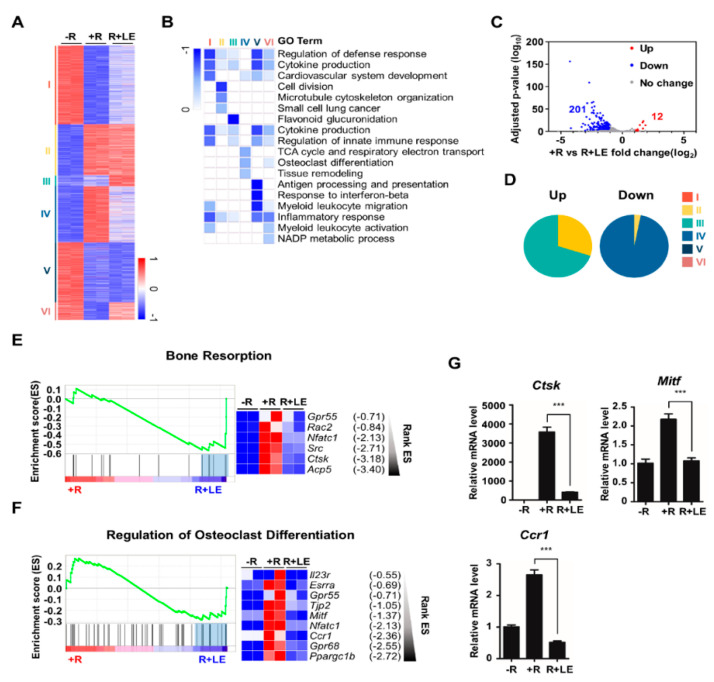
Leaf extract of Abeliophyllum distichum alters gene expression profiling during osteoclastogenesis. (A) K-means (K = 6) clustering of 2,573 differentially expressed genes (DEGs) in any pairwise comparison among three conditions. Clusters are indicated on the left (-R; no RANKL, +R; RANKL (100 ng/mL), R + LE; RANKL (100 ng/mL) + LE of A. distichum (10 μg/mL) for 3 days. (B) Heatmap showing the P-value significance of GO term enrichment for genes in each cluster. (C) Volcano plot of transcriptomic changes of RANKL-induced genes by LE treatment; colored dots correspond to genes with significant (FDR < 0.05) and greater than two-fold expression changes. (D) Pie chart showing each cluster portion of up or down DEGs. Up: Cluster 1 (33.2%), Cluster 2 (1.7%), Cluster 3 (21.3%), Cluster 4 (0%), Cluster 5 (0%), and Cluster 6 (43.8%). Down: Cluster 1 (0%), Cluster 2 (1.7%), Cluster 3 (0%), Cluster 4 (89.8%), Cluster 5 (7.6%), and Cluster 6 (0%). (E-F) GSEA analysis plot and heatmap showing decreased gene expression of the Bone Resorption and Regulation of Osteoclast Differentiation in LE compared to +R. (G) BMM cells were cultured for 3 days in the presence of M-CSF (30 ng/mL) and RANKL (100 ng/mL) in the absence or the presence of LE. To quantify relative mRNA levels, qRT-PCR was performed using primers specific for Ctsk, Mitf, and Ccr1. The results shown are mean values from three independent experiments; *** p < 0.001.

