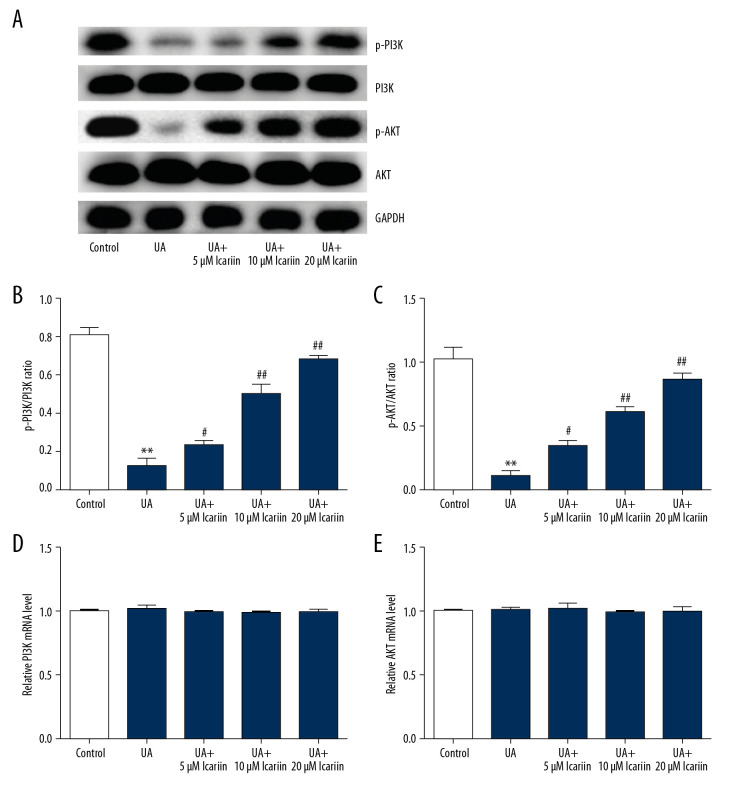
Figure 4.
Effects of icariin on PI3K/AKT signal pathway in UA-induced cell injury. Min6 cells were treated with icariin, UA and/or glucose for the indicated times. Cells were divided into six groups: control, UA, UA+5 μM icariin, UA+10 μM icariin, UA+20 μM icariin. (A) P-PI3K and p-AKT levels measured by western blotting. (B) p-PI3K/PI3K and (C) p-AKT/AKT ratios. Levels of (D) PI3K and (E) AKT mRNAs determined by qRT-PCR. ** P<0.01 compared with the control group; # P<0.05, ## P<0.01 compared with the UA group.

