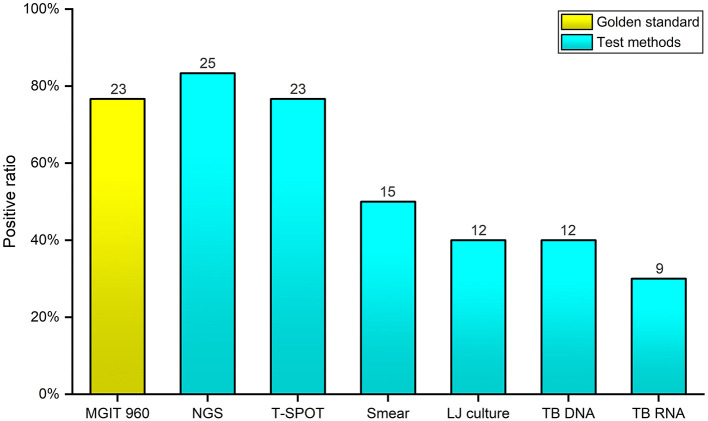
Figure 3.
Comparison of the positive rates of seven diagnostic methods for Mycobacterium tuberculosis complex and nontuberculous mycobacteria. The x-axis represents the seven different diagnostic methods; the y-axis represents the positive rate of Mycobacterium tuberculosis complex and nontuberculous mycobacteria identified by each method.

