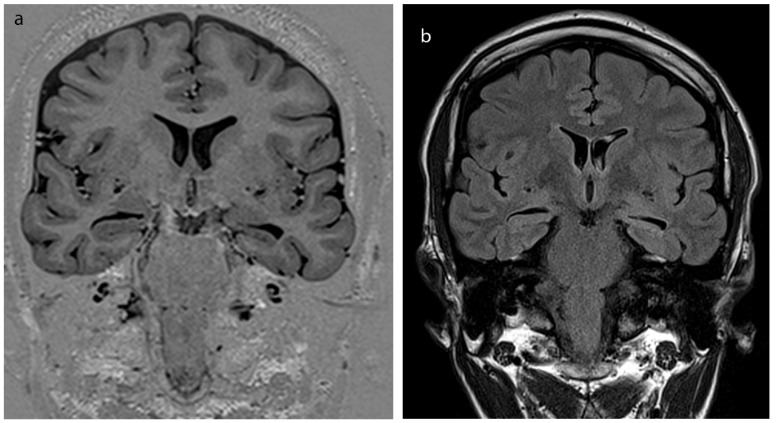
Figure 2.

(A) High resolution epilepsy dedicated imaging of subject no. 19. Left hippocampal atrophy can be depicted from isotropic, coronal oblique T1-IR sequence. (B) FLAIR image also shows increased signal at the side of atrophy, revealing hippocampal sclerosis of the same subject.
