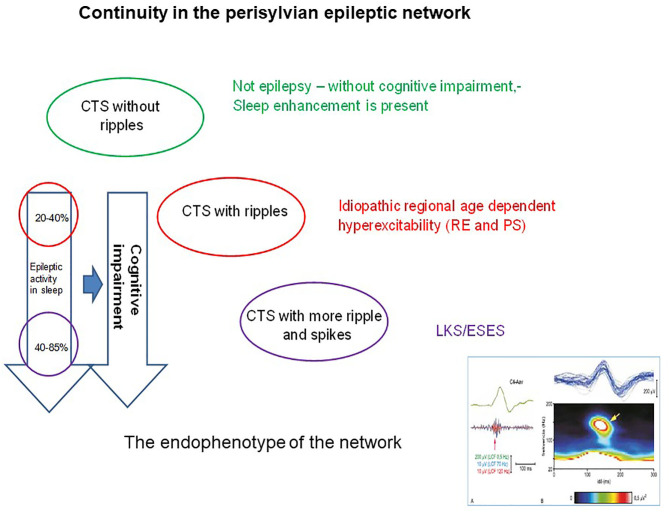
Figure 6.
The continuity in the perisylvian epileptic network. The colors indicate the syndromes in the spectrum. Identically colored circles containing the changes in pattern of the common endophenotype (the centrotemporal spike). The perpendicular arrows indicate the degree of cognitive impairment (right arrow) proportional with the degree of spiking (left arrow). The right insert below shows the shared endophenotype (CTS with ripples).

