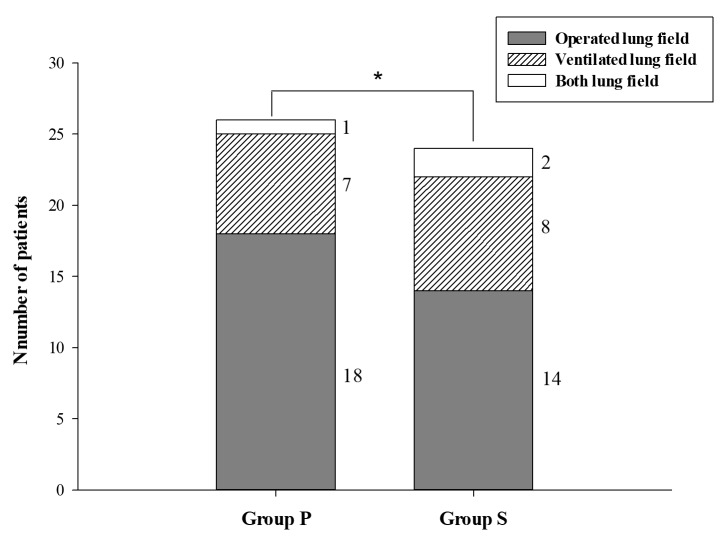
Figure 2.
The incidence of early postoperative chest radiographic abnormalities. Numbers printed at the left side of each bar indicate the lung field where abnormalities occurred; its legend is presented. *: 2-sided P < 0.050 with z-test. Incidence was 43.5% vs. 26.7% for groups P and S, respectively, P = 0.013, Cohen’s h = 0.35. There was no significant difference between groups on the lung fields where abnormalities occurred (P = 0.359, Crémer’s V = 0.14, Fisher’s exact test).

