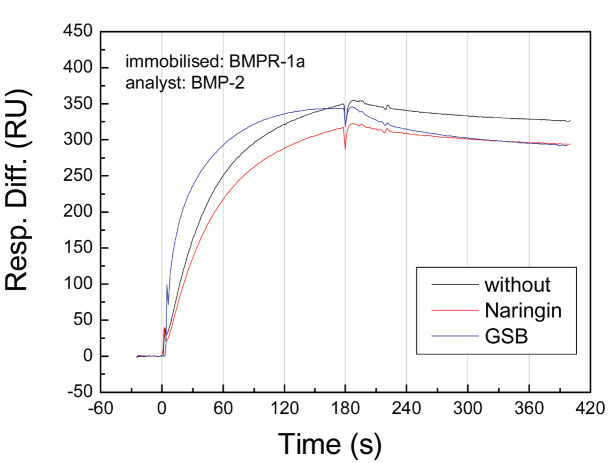
Figure 2.
Binding curve of BMP-2 and BMPR in cells pretreated with naringin. BMPR-1A was immobilized on the SPR chip and maintained in a flow system at a flow rate of 10 μL/min. BMP-2 solution was injected into the flow system and passed through immobilized BMPR-1A. Binding was recorded in real-time based on the SPR response. Prior to BMP-2 injection, the test solutions were preinjected through the immobilized BMPR-1A. The black, red and blue curves represent BMP-2 binding alone and with preinjection of naringin and GSB solution, respectively.

