FIGURE 3.
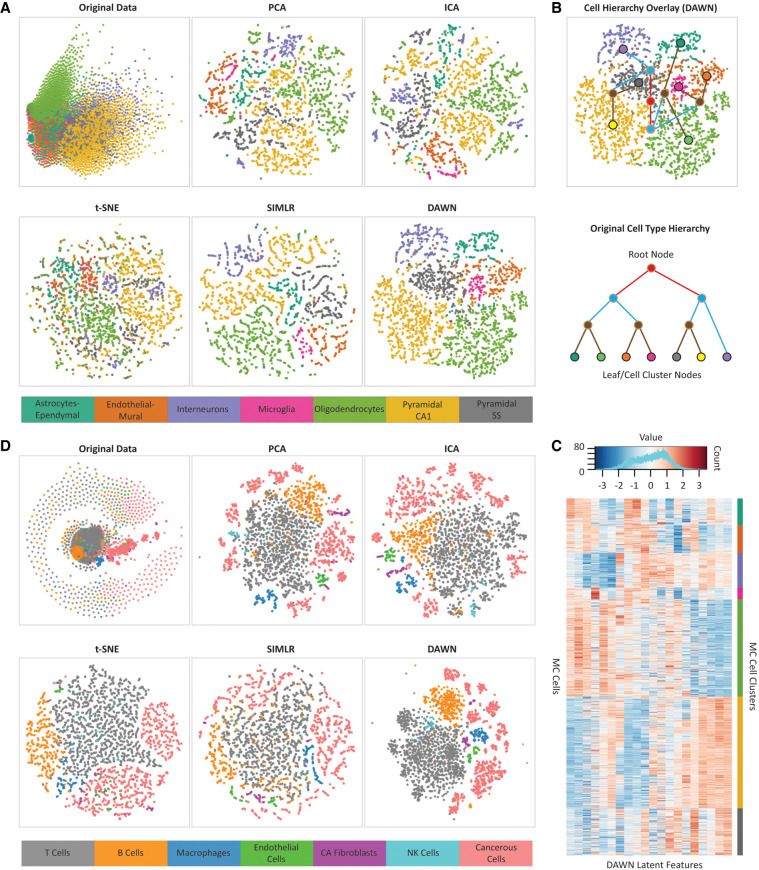
Analysis of clustering performances using visualization approaches. (A) Two-dimensional embedding of the mouse cortex (MC) data set in the original feature space compared with the embeddings of the same data set in the feature space generated by DAWN and four other feature learning methods, principle component analysis (PCA), independent component analysis (ICA), t-distributed stochastic neighbor embedding (t-SNE), and single-cell interpretation via multikernel learning (SIMLR). (B) Hierarchical clustering overlay (top) constructed from the two-dimensional embedding of the DAWN feature space. The hierarchy is created based on the proximities of mass centers of the obtained clusters. The obtained hierarchy is compared to that of biological cell types (bottom) extracted from the original study (Zeisel et al. 2015). The leaf nodes correspond to the original cell types, while the root and internal nodes correspond to the three other levels obtained through the agglomerative hierarchy. The two-dimensional embedding of the DAWN feature space can recover all but one of the defined relationships between the related cell types extracted from the literature. (C) The heatmap of the 20 latent features generated by DAWN on the MC data set, showing the block structure of the expression profiles of the individual cells grouped by the cell types (bottom). The values of the latent features corresponding to the weights in the hidden layer are distributed in [−3, 3] range (top). (D) Two-dimensional embedding of the malignant melanoma (MM) data set in the original feature space compared with the embeddings of the same data set in the feature spaces generated by DAWN and four other feature learning methods: PCA, ICA, t-SNE, and SIMLR.

