FIGURE 5.
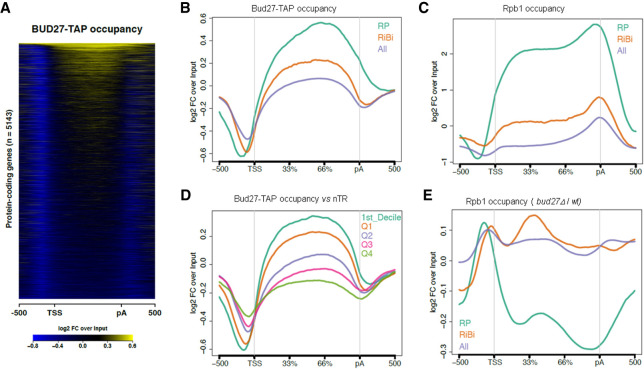
ChIP-seq analysis of Bud27 occupancy. (A) Heatmap of the input-normalized Bud27-TAP ChIP-seq signals over a region that includes the gene body 500 bp upstream of the transcription start site (TSS), and 500 bp downstream from the cleavage and polyadenylation sites (pA). The heatmap includes all the protein-coding genes with TSS and pA annotations. (B) The input-normalized average metagene profile of the occupancy of Bud27-TAP over gene bodies and flanking regions of all protein-coding genes from Figure 5A and the subsets of the RP (n = 129) and RiBi (n = 236) genes. (C) The same as in panel B for Rpb1 ChIP-seq. (D) The average metagene profile of the occupancy of Bud27-TAP over the gene bodies and flanking regions of all the protein-coding genes, separated by the nascent transcription rate level (nTR). Q1–Q4 indicates the nTR quartiles. D1 refers to the first nTR decile. (E) The average Rpb1 ChIP-seq occupancy change profile (bud27Δ /wt ratio) over the three groups of the analyzed genes.

