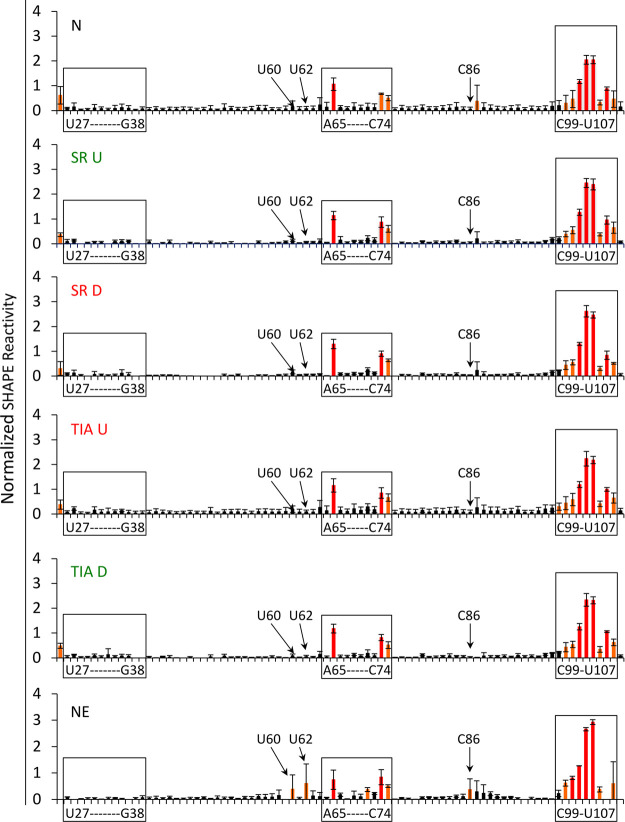
FIGURE 5.
Reactivity plots of enriched U1 snRNAs and nuclear extract U1 snRNA. Black bars (0–0.3) signify background reactivity, orange bars (0.3–0.7) signify intermediate reactivity, and red bars (≥0.7) indicate highly reactive nucleotides. The y-axis represents the normalized SHAPE reactivity and the x-axis indicates the nucleotide position from 5′ to 3′ in the U1 snRNA sequence. Loop nucleotides for stem–loops I and II are indicated in addition to nucleotides that display different SHAPE reactivities between enriched conditions and the NE condition. The reactive nucleotides for stem–loop III are also indicated.

