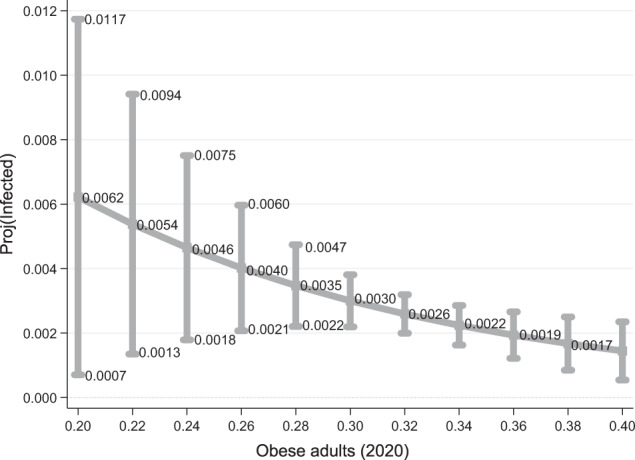
Fig. 1. Projected infections by coronavirus vs. prevalence of obese adults in US States.

Y1 = Infected = in each US state (excluding the outlier of Samoa). Projections are based on the following fractional logit regression analysis of the linear model given in column (1), where OR = odd ratio = .
