
Figure 1. Single-Cell Transcriptional Characterization of Stage 6 and Grafted hPSC-Islets Identifies Endocrine and Non-Endocrine Cell Populations.
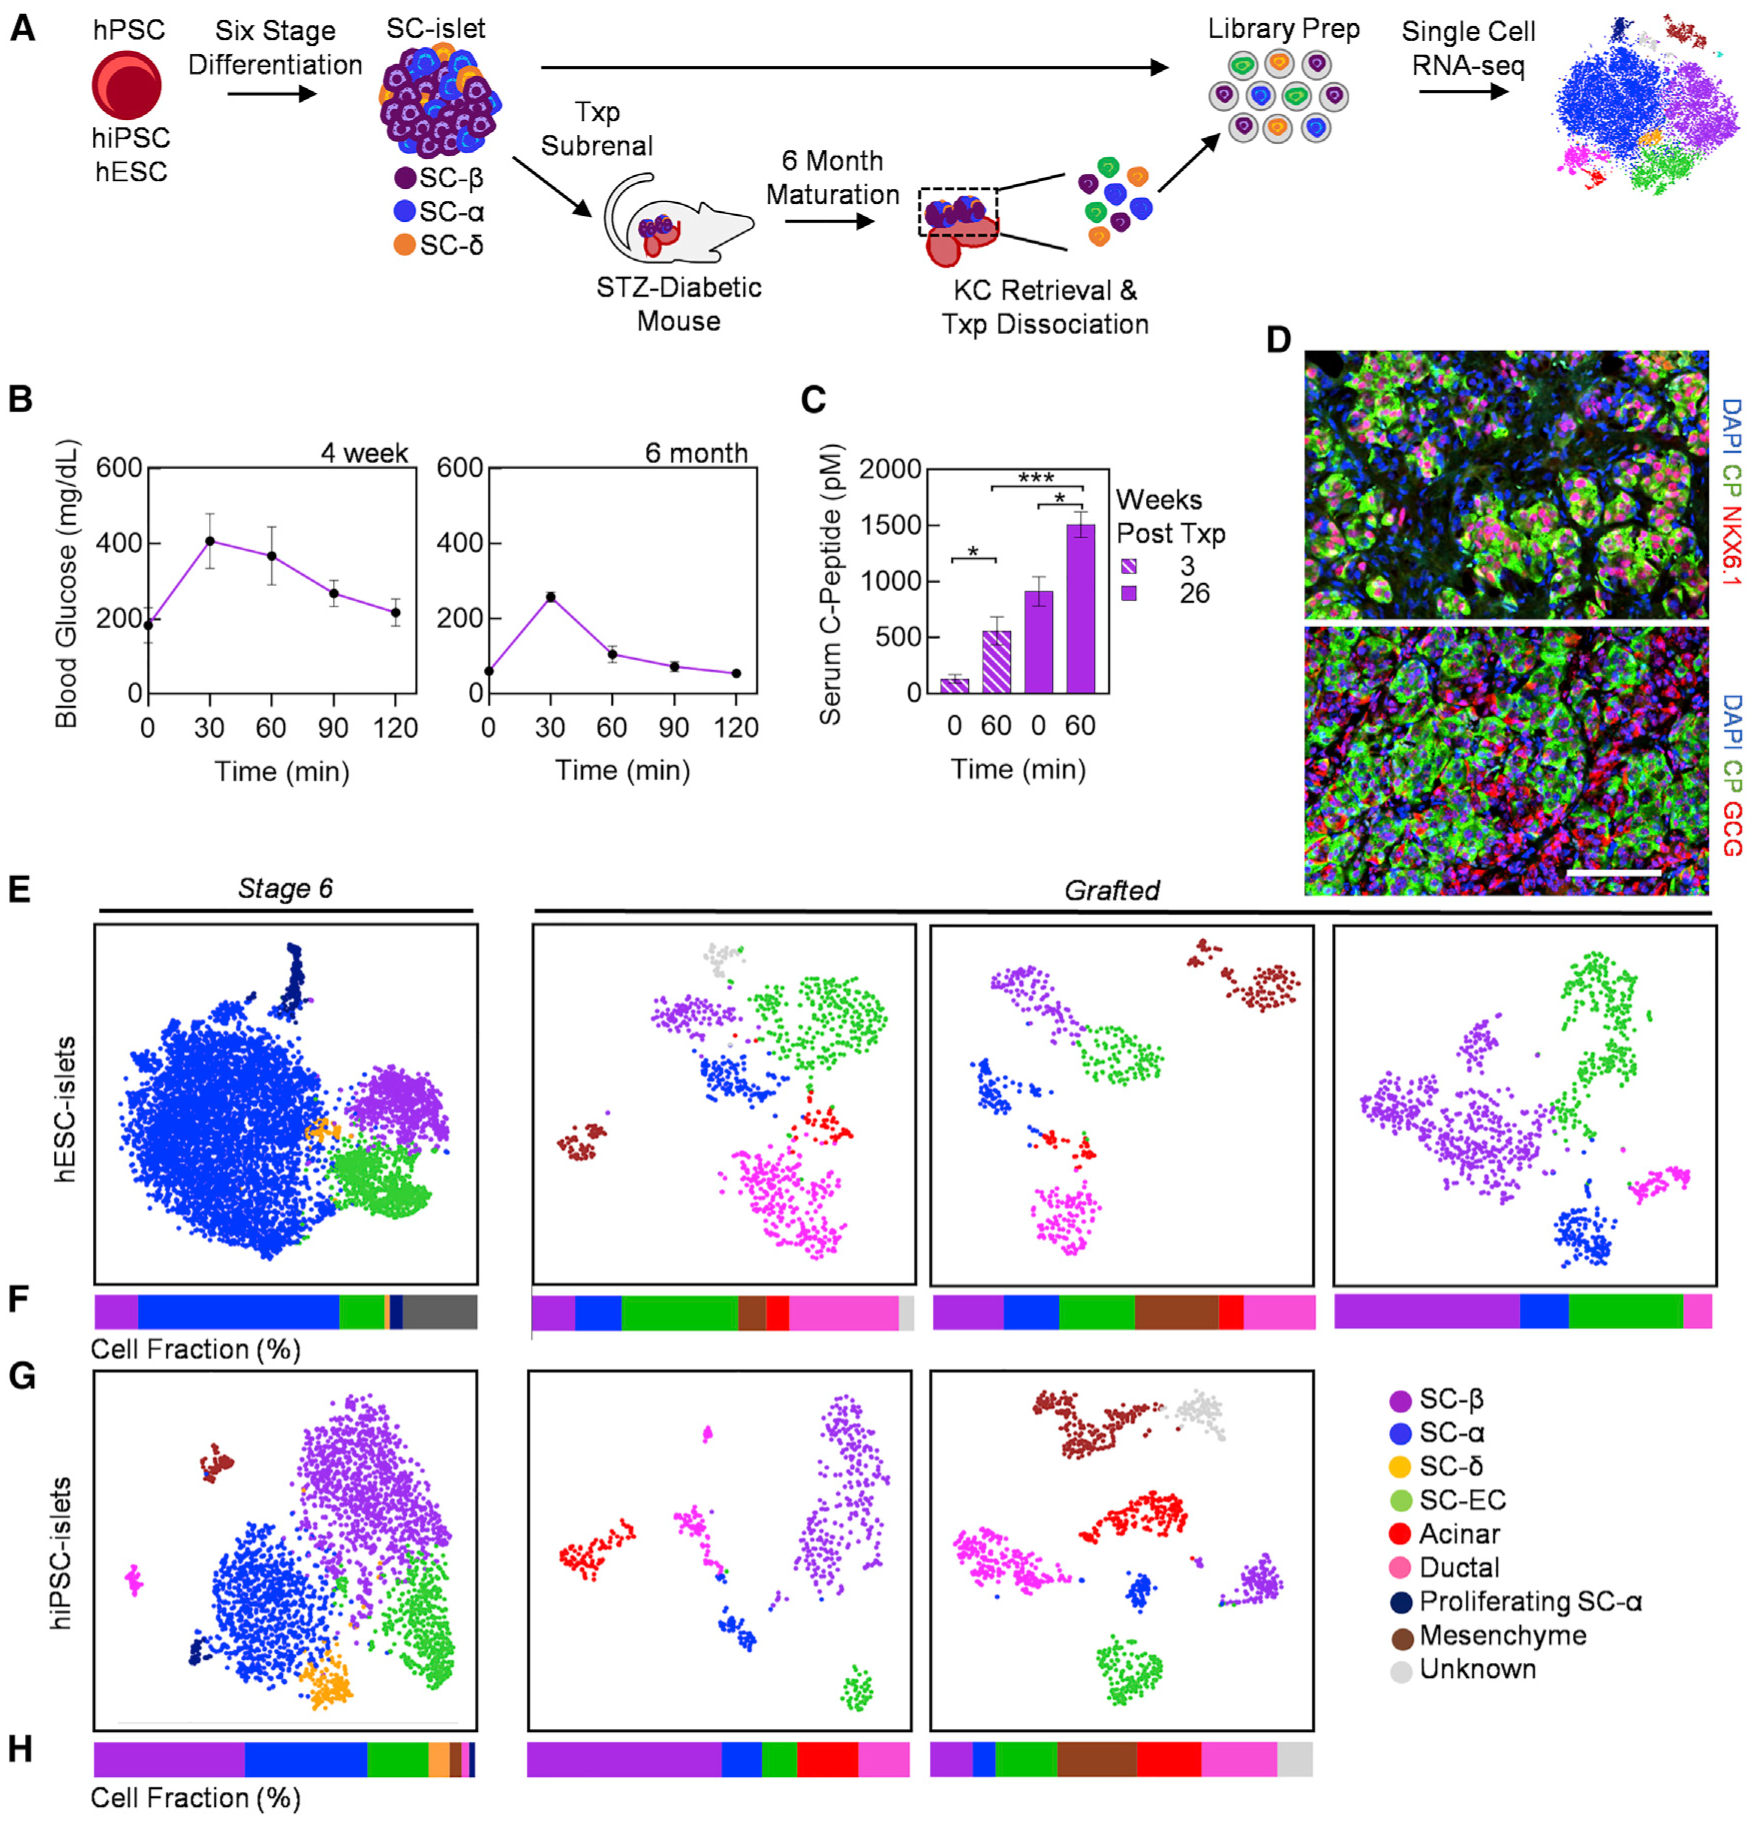
(A) Schematic summary of single-cell analysis of stage 6 SC-islets and grafted SC-islets following 6 months of in vivo maturation in diabetic mice.
(B) Glucose tolerance test (GTT) at 4 weeks and 6 months after transplantation of SC-islets (n = 5).
(C) In vivo glucose-stimulated CP secretion at 0 min, before, and 60 min after glucose injection at 3 and 26 weeks post-transplantation (n = 5). *p < 0.05, ***p < 0.001 by two-way unpaired t test.
(D) Immunostaining of kidney graft explanted form SC-islet transplanted mice at 6 months. Scale bar, 100 μm.
(E–H) Individual tSNE projection (E and G) and cell population fractions (F and H) from unsupervised cluster of stage 6 and grafted hESC- and hiPSC-islets. CHGA, chromogranin A; CP, C-peptide; EC, enterochromaffin; GCG, glucagon. Error bars represent SEM. See also Figure S1 and Table S2.