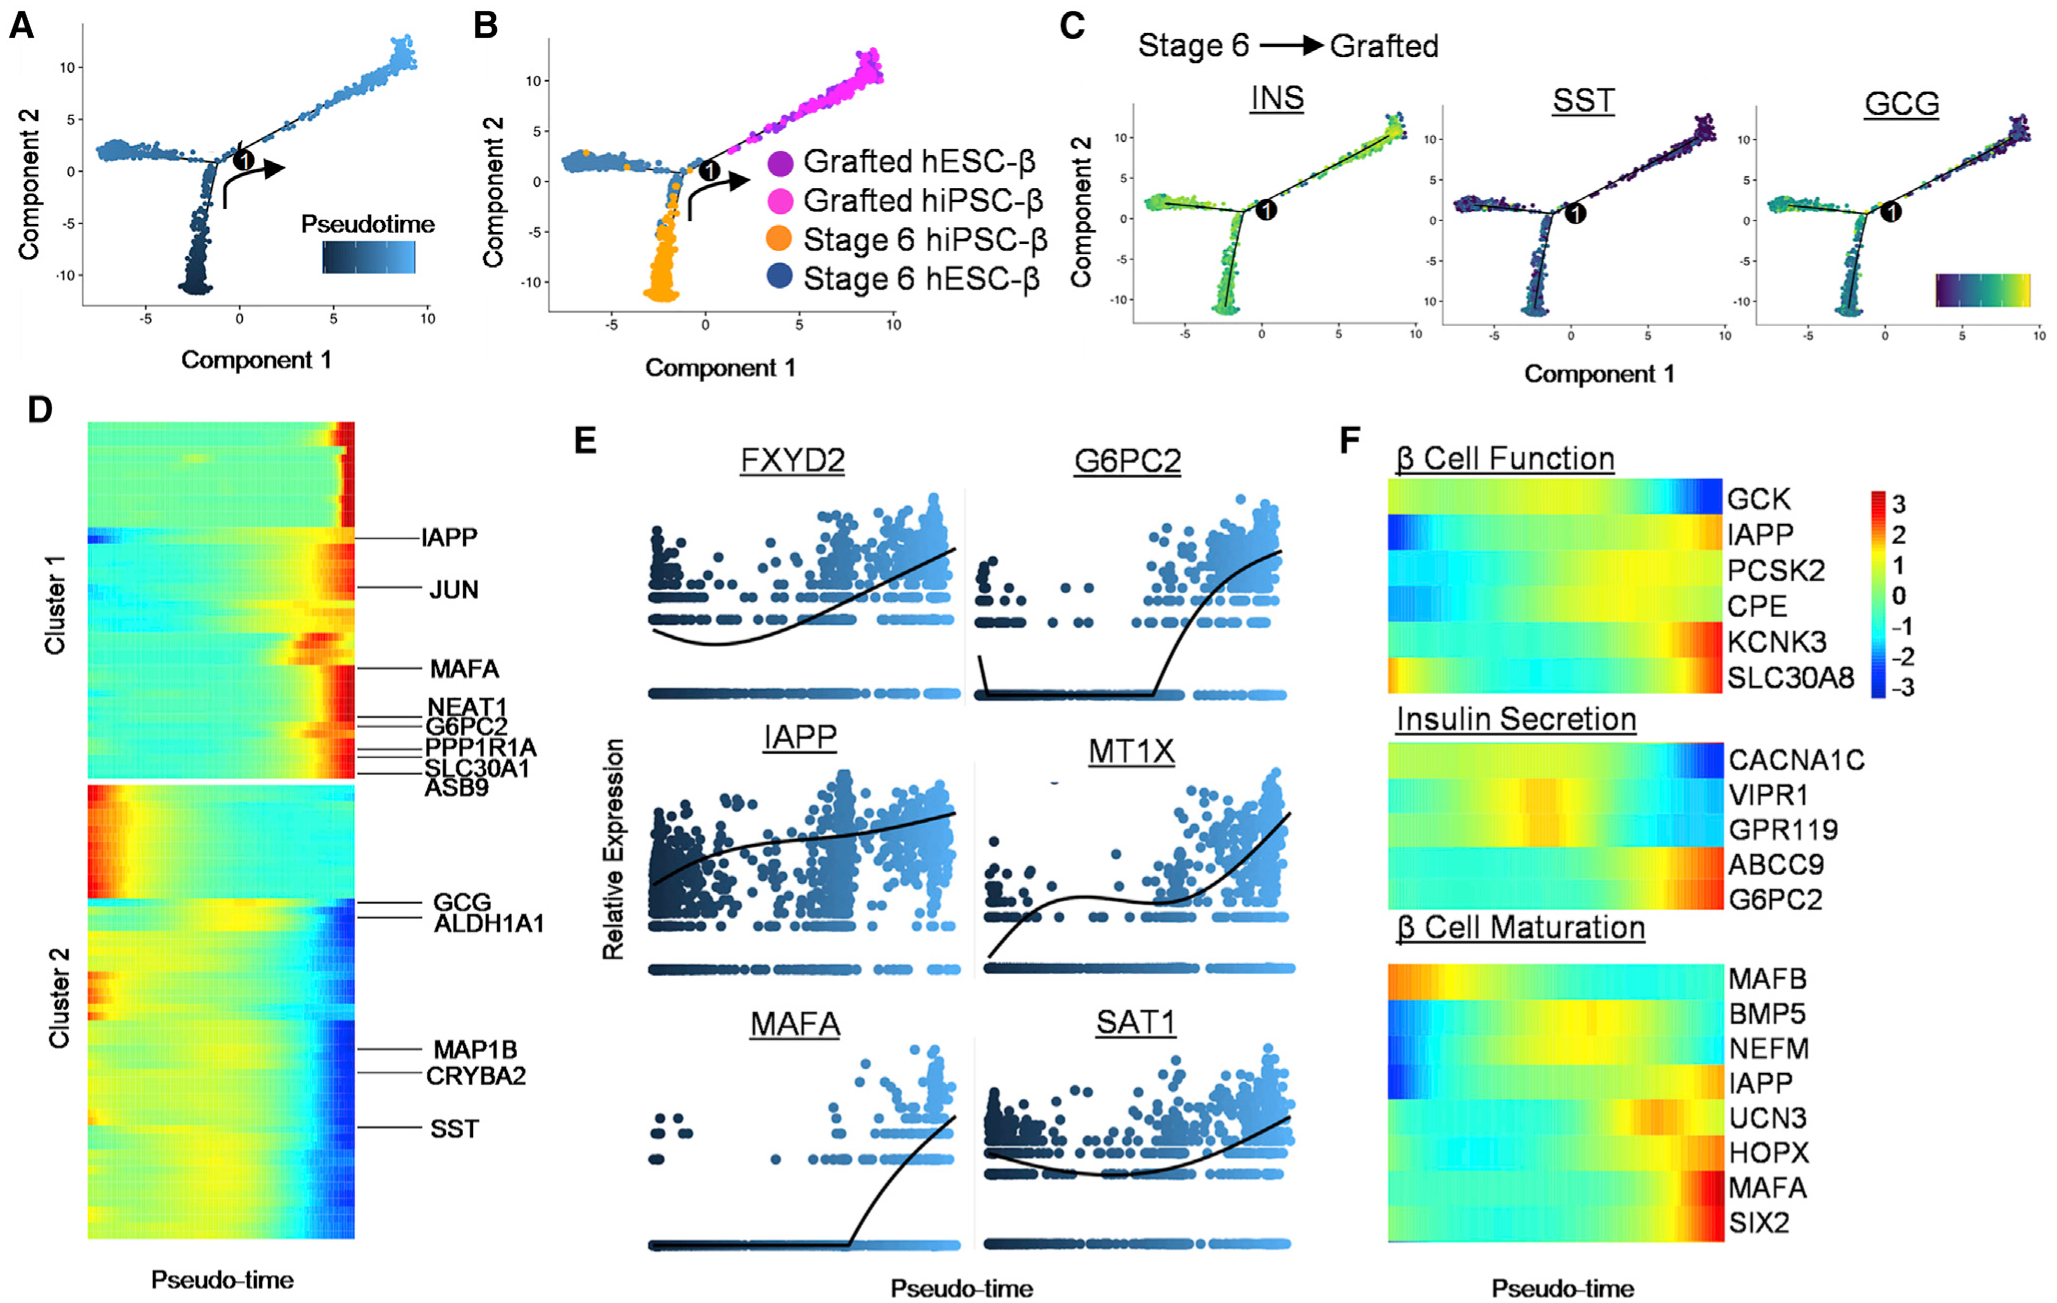
Figure 3. Pseudo-Time Analysis Projects Stage 6 SC-β Cell Maturation into Grafted SC-β Cells after Transplantation.

(A) Pseudo-time trajectory of stage 6 and grafted SC-β Cells with one branching point.
(B) Distribution of SC-β Cells from grafted hESC-β (purple), grafted hiPSC-β (pink), stage 6 hiPSC-β (orange), and stage 6 hESC-β Cells (blue). (C) Changes in gene expression of endocrine hormones—INS, somatostatin (SST), and GCG—along pseudo-time projection for SC-β Cells. Scale: relative expression.
(D) Analysis of top 100 branch-dependent genes determined based on clusters identified through pseudo-time analysis of SC-β Cells, found in Table S4. Scale: relative expression.
(E) Relative expression level of selected β Cell genes along SC-β Cell pseudo-time.
(F) Gene expression heatmap of select β Cell genes focused on function and maturation along pseudo-time. Scale: normalized expression. See also Figure S3 and Table S4.
