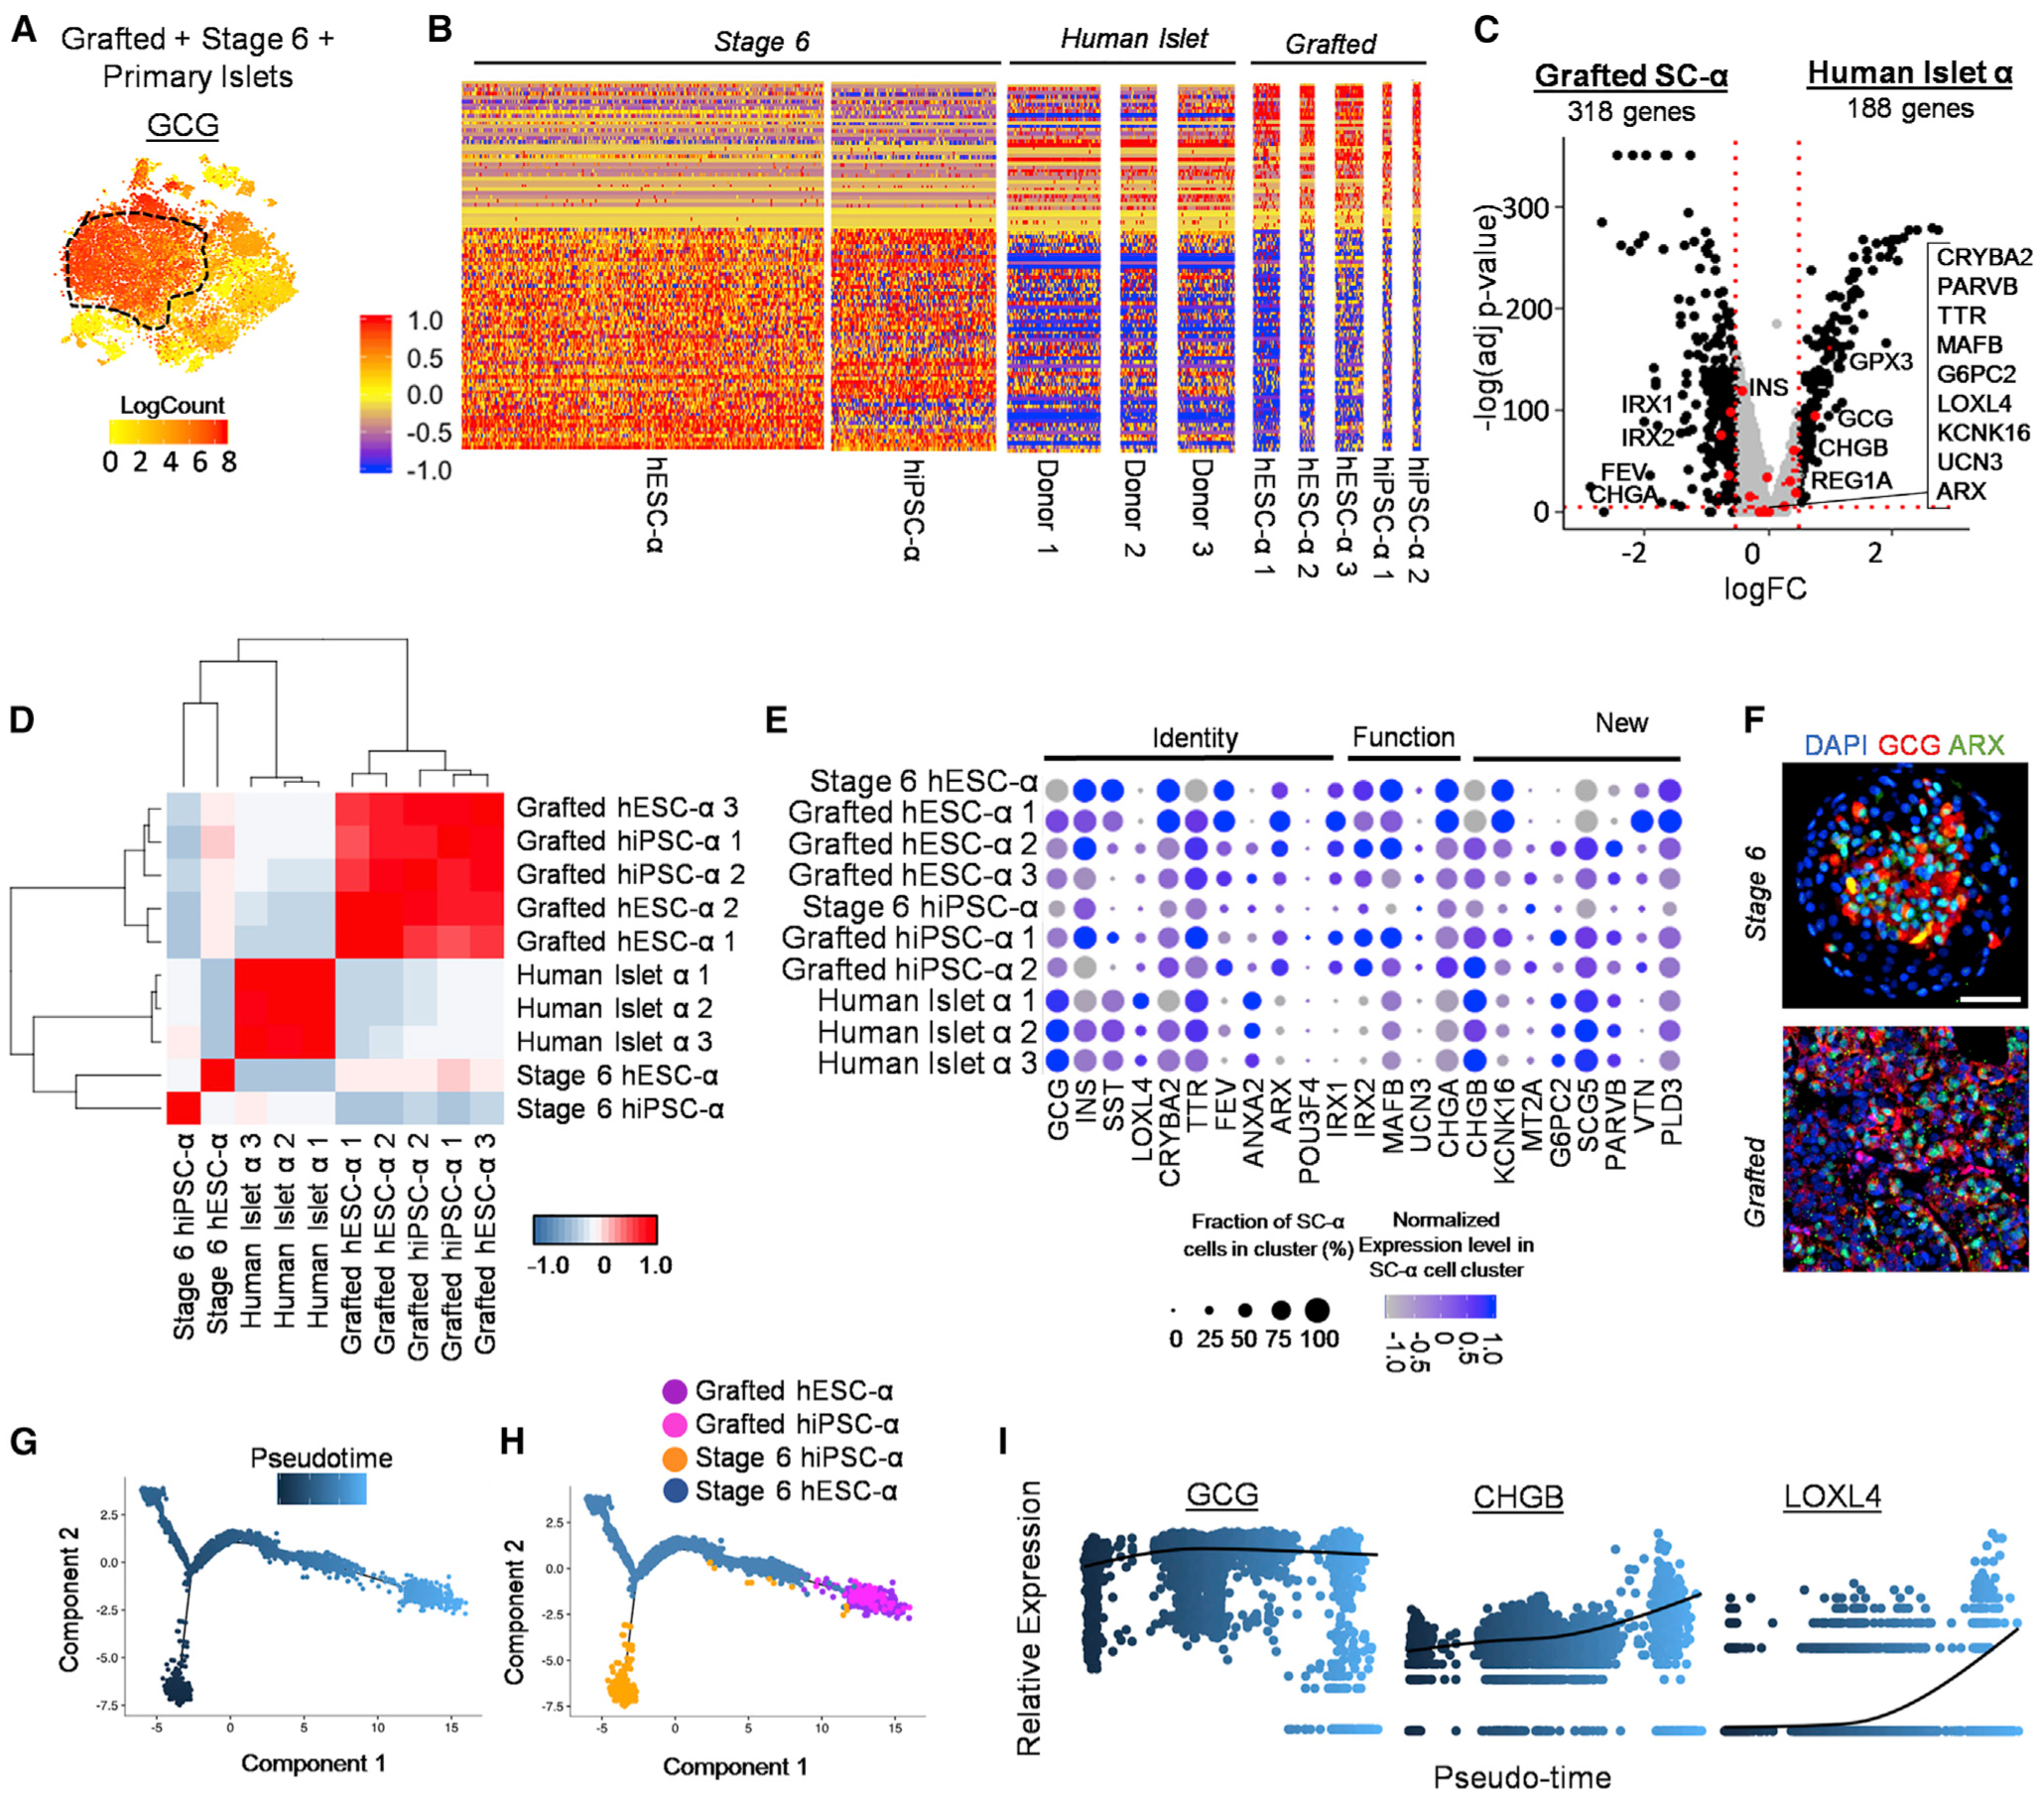
Figure 5. Single-Cell Transcriptome and Pseudo-Time Analysis Indicates Stage 6 SC-α Cells Mature during Transplantation to More Closely Resemble HI α cells.

(A) Heatmap of GCG gene expression to distinguish SC-α cell populations within tSNE plot from Figure 4A.
(B) Normalized gene expression values for two stage 6 SC-α, five grafted SC-α, and three primary HI (donor) α cells of the 100 most differentially expressed genes between stage 6 and grafted SC-α cells listed in Table S6. Scale: normalized expression.
(C) Volcano plot displaying FC differences of α cell genes between grafted SC-α (left) and HI α cells (right). Dashed lines are drawn to define restriction of log FC value of 0.25 and −log of adjusted p value 0.001. Key α cell genes are labeled and colored red.
(D) Pearson correlation matrix and hierarchical clustering to identify most similar populations among all α cell samples using top 430 variable genes. Pearson correlation values detailed in Table S6. Scale: correlation coefficient.
(E) Normalized expression values for key α cell identity, function, and newly identified genes among stage 6 SC-α, grafted SC-α, and primary human α cells. Percentage of cells positive for designated gene is represented by circle size, and saturation indicates low (gray) or high (blue) expression of the gene.
(F) Immunostaining of stage 6 and 6-month kidney graft containing SC-islets for α cell markers. Scale bar, 50 μm.
(G and H) Pseudotime trajectory (G) and distribution (H) of SC-α cells from seven hPSC-α samples.
(I) Relative expression level of selected α cell genes along SC-α cell pseudo-time. Scale: relative expression. Each dot represents a different cell. See also Figure S5 and Tables S3, S4, and S6.
