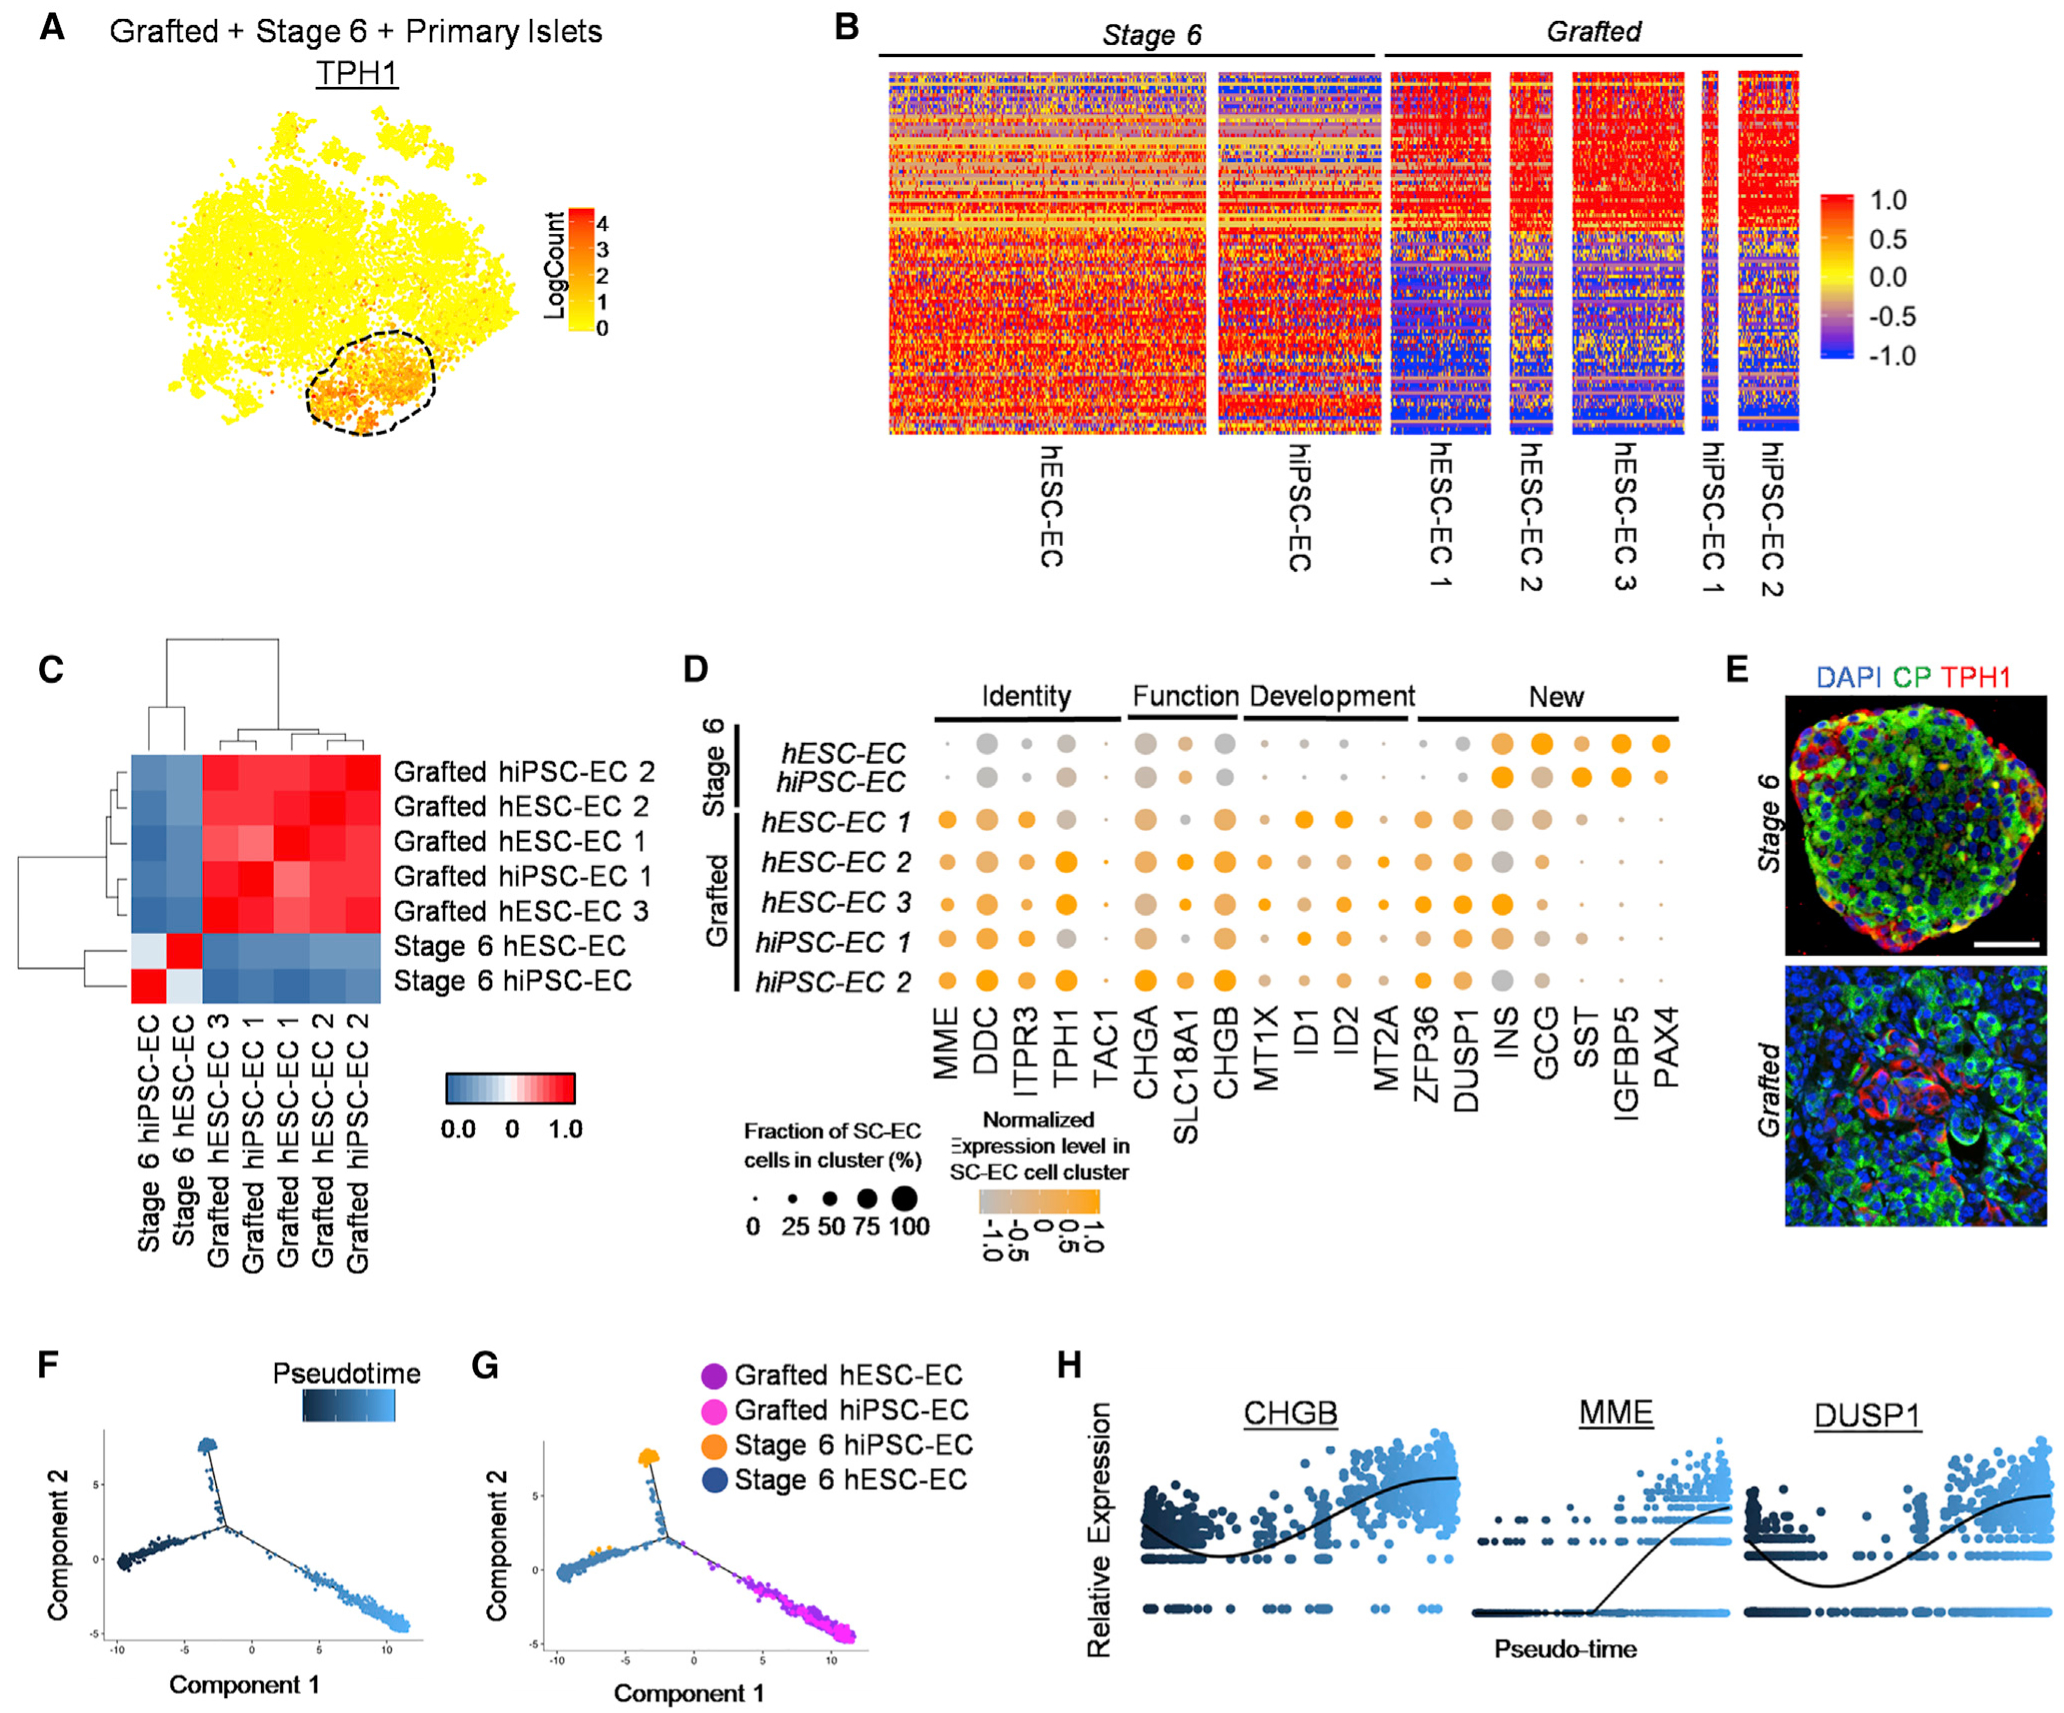
Figure 6. Analysis of Pseudo-Time and Single-Cell Transcriptomes of Stage 6 hPSC-ECs and Grafted hPSC-EC Cells Following Trans plantation.

(A) Heatmap of TPH1 gene expression to distinguish SC-EC cell population within tSNE plot from Figure 4A.
(B) Gene expression values for two stage 6 SC-EC cells and five grafted SC-EC cells for the 100 most differentially expressed genes between stage 6 and grafted SC-EC cells listed in Table S6. Scale: normalized expression.
(C) Pearson correlation matrix and hierarchical clustering to identify most similar populations among all EC cell samples using top 430 variable genes. Scale: correlation coefficient.
(D) Expression values for key EC cell identity, function, development, and newly identified genes between stage 6 and grafted SC-EC cells.
(E) Immunostaining of stage 6 and 6-month kidney graft containing SC-islets for EC cell marker TPH1. Scale bar, 50 μm.
(F and G) Distribution (F) of SC-EC cells along pseudo-time trajectory (G) from seven SC-EC samples.
(H) Relative expression of select EC cell genes along SC-EC cell pseudo-time. Scale: relative expression. Each dot represents a different cell.
TPH1, tryptophan hydroxylase 1. See also Figure S6 and Table S4.
