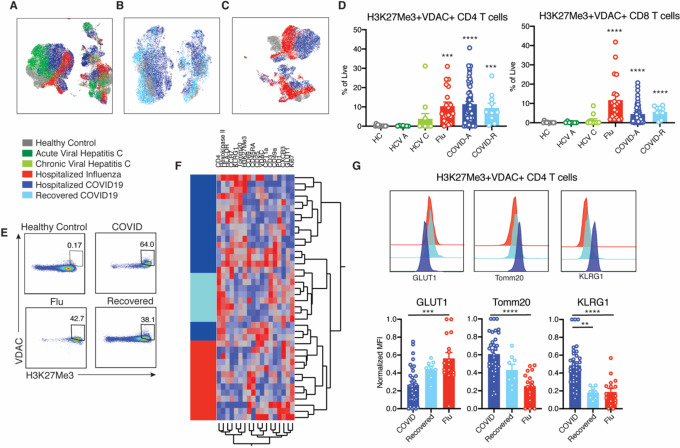
Figure 2: Novel H3K27me3+VDAC+ T cells are unique in COVID-19 compared with other viral infections.
A. UMAP projection of pooled donors with active infection, color coded by disease. B. UMAP projection of acute and recovered COVID-19 compared to healthy controls. C. UMAP projection of influenza and acute COVID-19 compared to healthy controls. D. Frequency of H3K27Me3+VDAC+ CD4 and CD8 T cells as percent of total live cells. E. Representative gating of H3K27Me3+VDAC+ CD4 T cells from multiple disease states. F. Hierarchical clustering of H3K27Me3+VDAC+ CD4 T cells based on expression (MFI values) of indicated proteins. Comparison of hospitalized acute COVID-19 infection (dark blue), recovered COVID-19 (light blue) and hospitalized influenza (red). G. Normalized MFI of GLUT1, TOMM20 and KLRG1 in all patients and representative histogram overlays of MFI. Each dot represents one individual, significance tested using unpaired Kruskal-Wallis test compared to healthy control (D) or every combination (G). *p < 0.05, **p < 0.01, ***p < 0.001, and ****p < 0.0001

