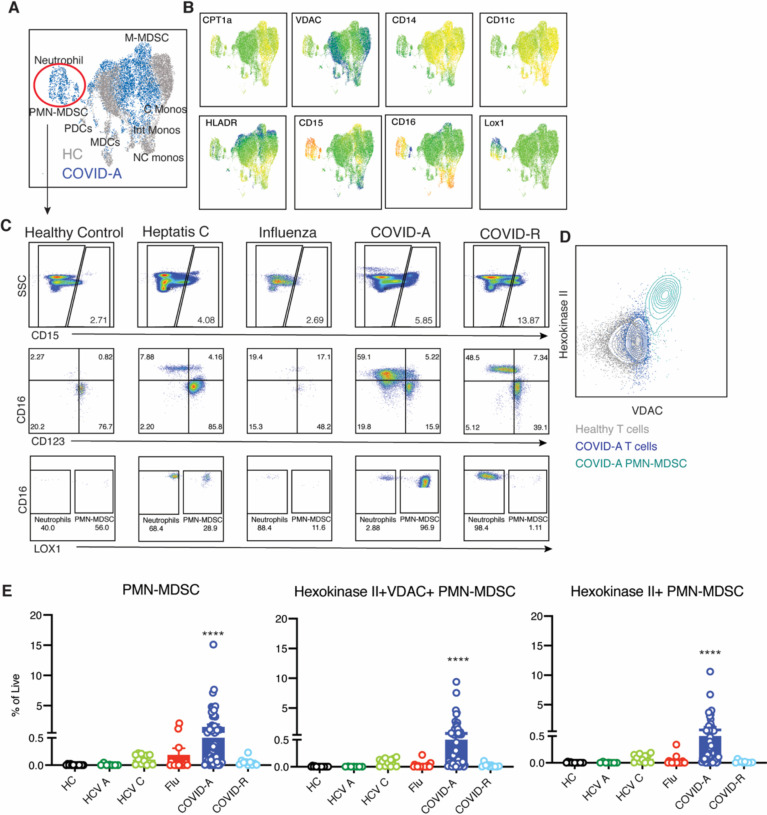
Figure 5: Metabolically distinct granulocytic immunosuppressive myeloid derived suppressor cells in PBMC of COVID-19 patients.
A. Concatenated flow cytometry data depicted as UMAP projection of CD3−CD19−CD56− myeloid cells from healthy control (HC, grey) and acute COVID-19 patients (COVID-A, blue). B. UMAP projection of MFI heatmap overlays of indicated proteins. C. Representative gating of CD15+ granulocytic subsets basophils, eosinophils, neutrophils and PMN-MDSC across all disease states studied. D. Flow plot comparing HKII and VDAC expression in HC T cells (grey), COVID-A T cells (dark blue) and COVID-A PMN-MDSC (light blue). E Frequency of indicated cell subset as percent of total live cells. Each dot represents one individual, significance tested using unpaired Kruskal-Wallis test compared to healthy control. *p < 0.05, **p < 0.01, ***p < 0.001, and ****p < 0.0001

