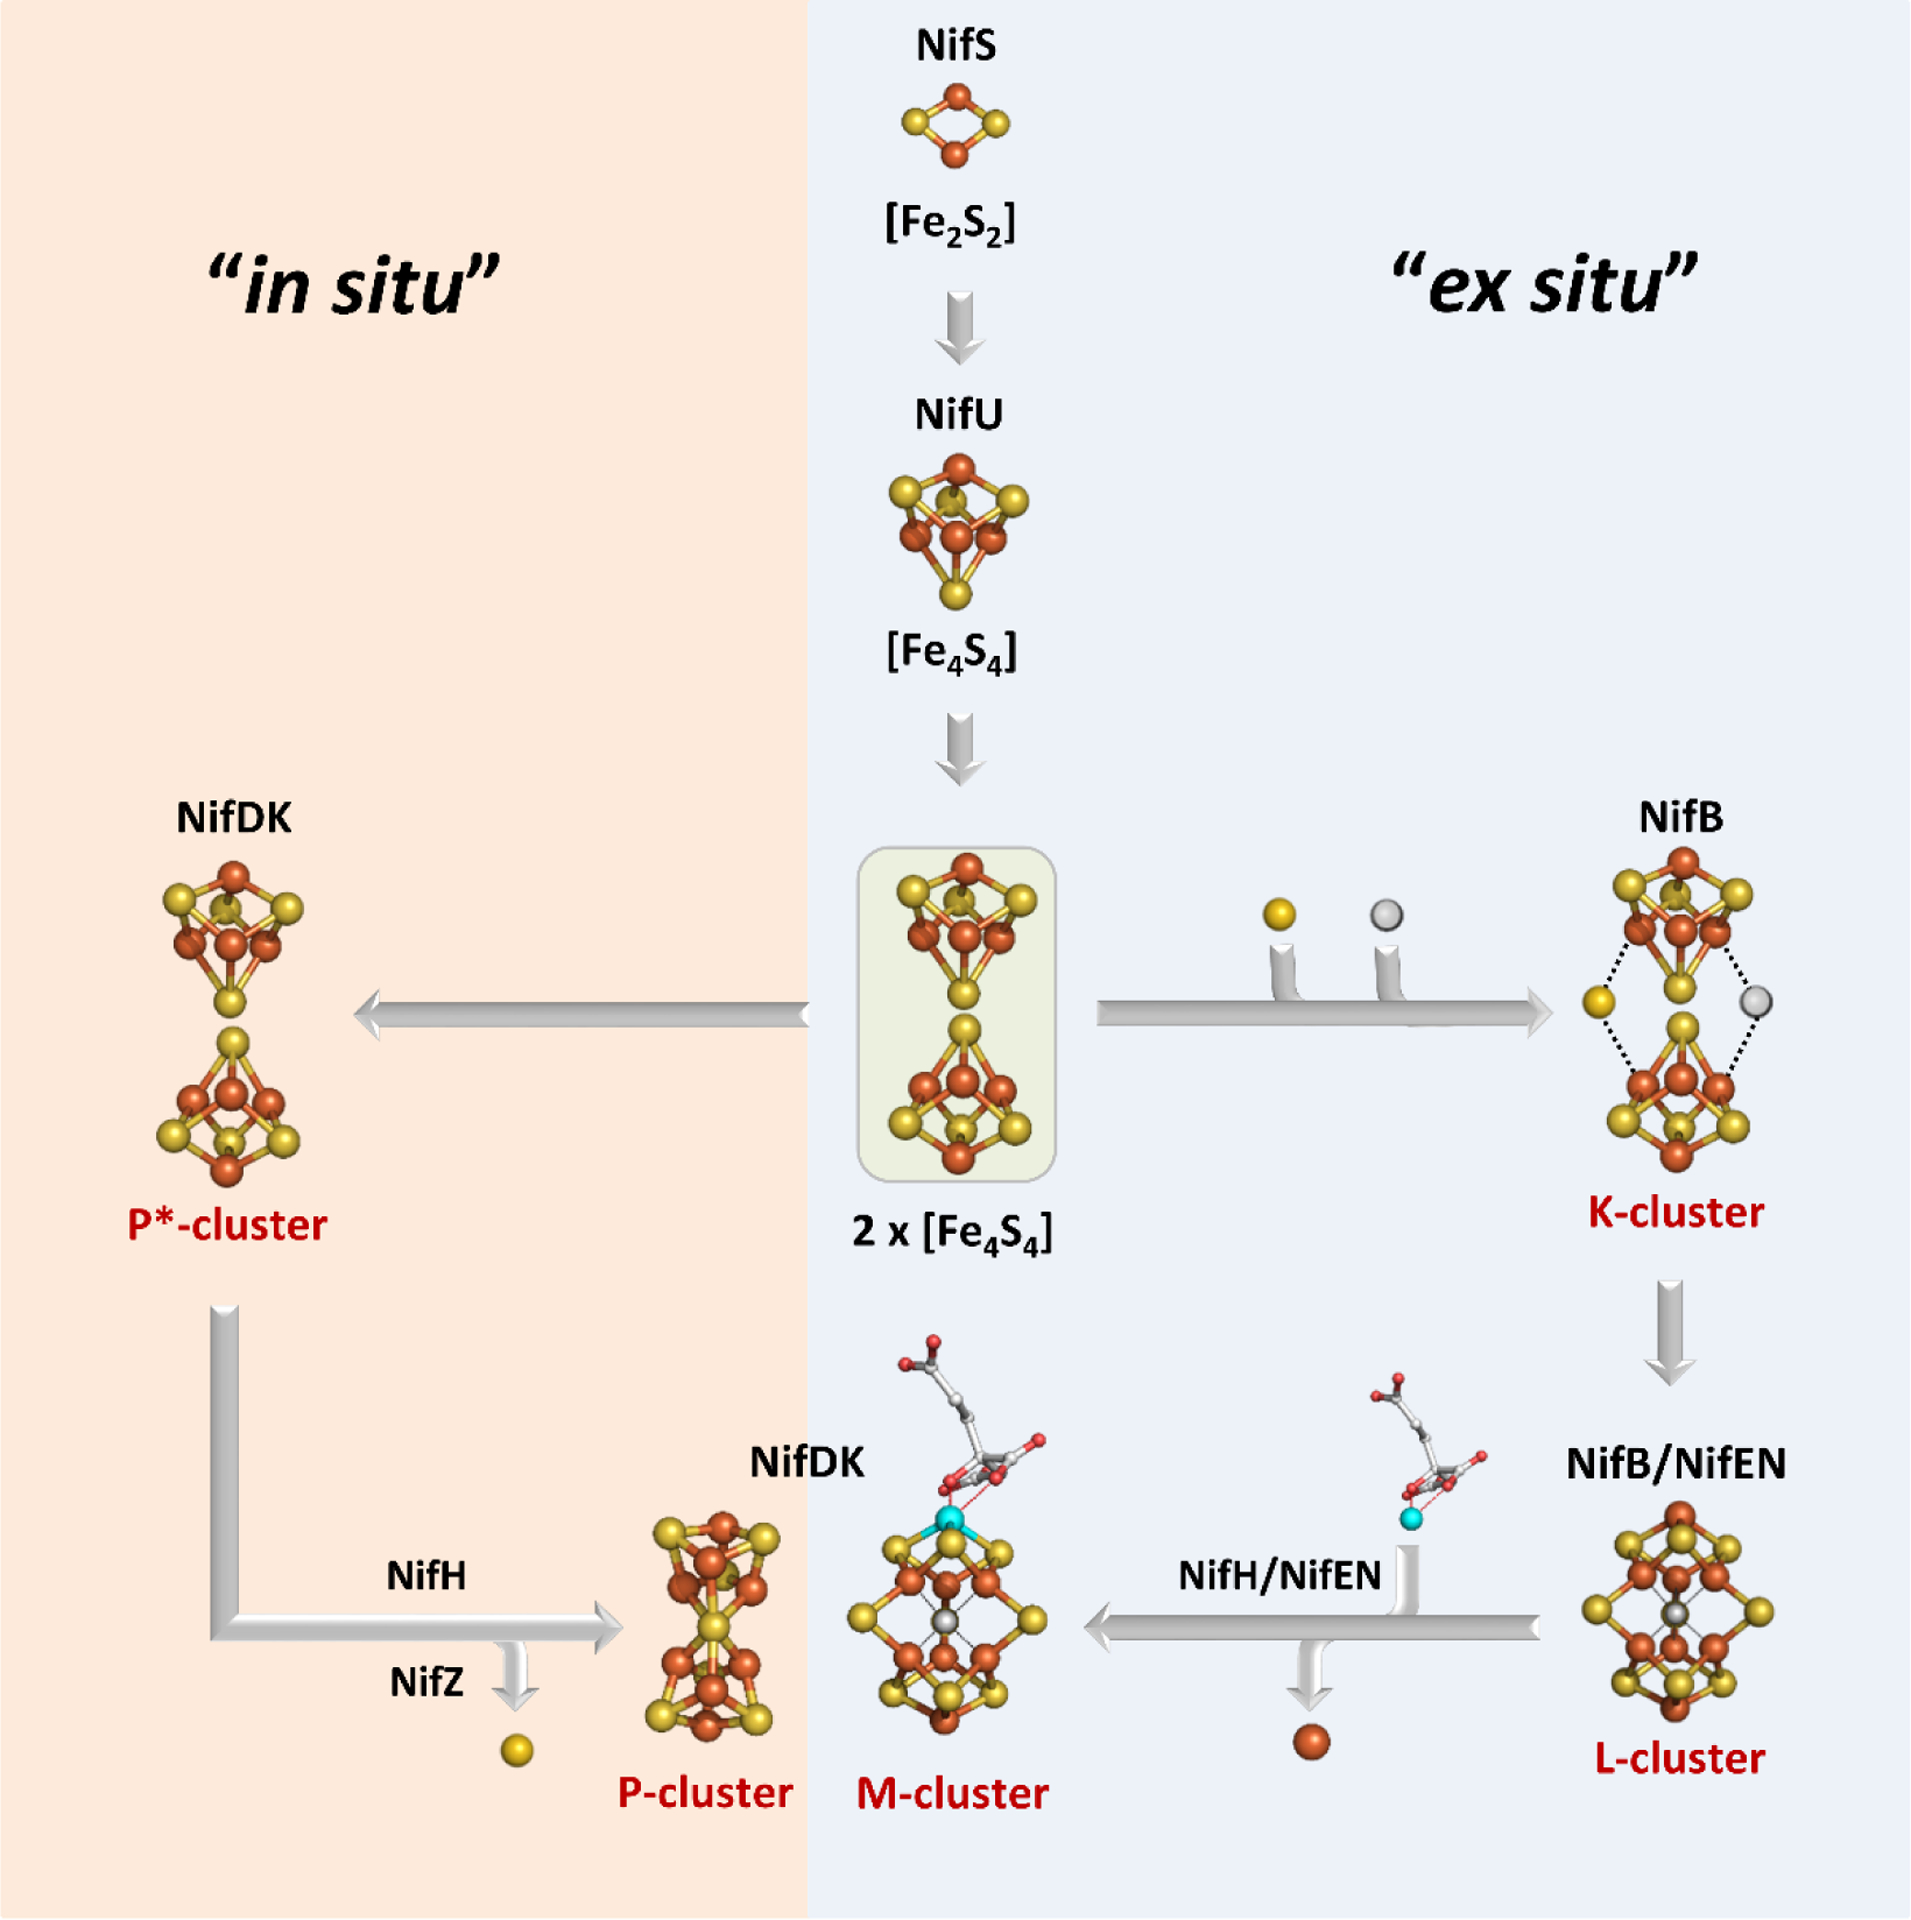
Figure 1.

Flow diagram for the assembly of nitrogenase cofactors. The orange “in situ” pathway represents the assembly of the P-cluster on NifDK, whereas the blue “ex situ” block shows the assembly of the M-cluster. Assembly proteins are labeled in black; cluster species are labeled in red. Atoms are represented as ball-and-stick models and colored as follows: Fe, orange; S, yellow; C, grey; O, red; Mo, teal. Adapted with permission from ref 32. Copyright 2014 American Chemical Society.
