
Figure 12.
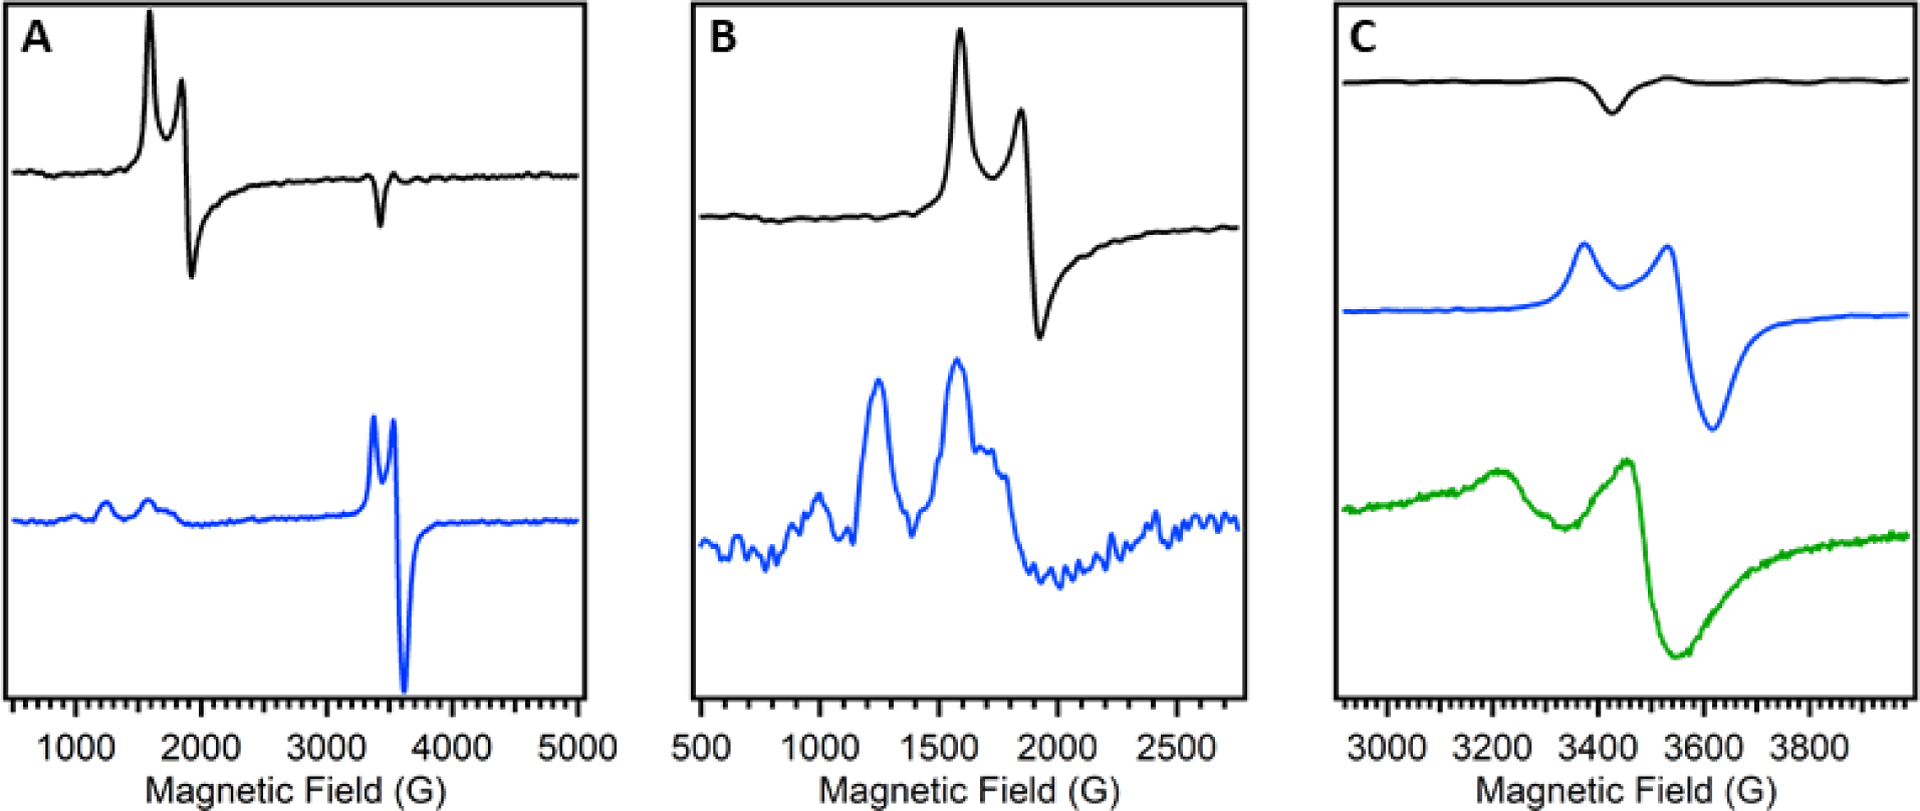
Representative EPR spectra of Av NifDK (black) and Av VnfDGK (blue). A: Spectrum of the full range of data. B: Spectrum of the low field region, Av VnfDGK data has been scaled for visibility. C: Spectrum of the high field region, additionally the apo-VFe protein (Av ΔnifB VnfDGK, green) is included. Data for the MoFe and VFe proteins was reported in ref 149 and data for apo-VFe protein was reported in ref 34. Note that the spectra shown in the figure were not recorded under identical conditions.