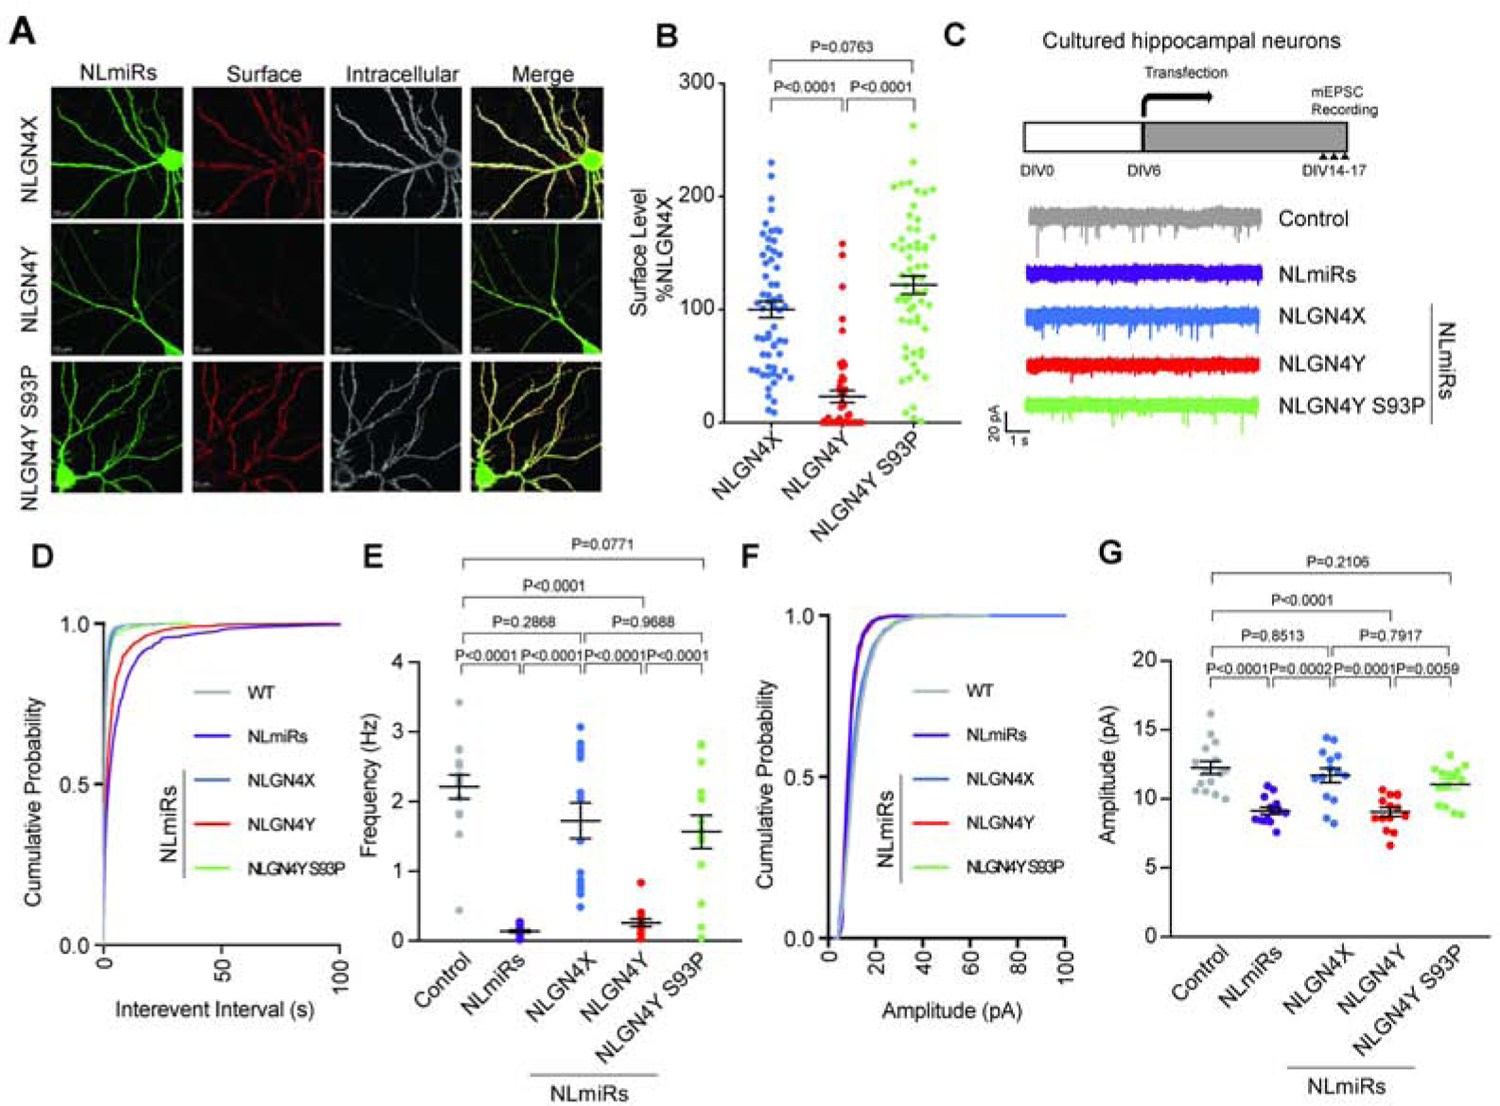
Figure 3. NLGN4Y S93 regulates differential surface expression and functional effects of NLGN4X vs. NLGN4Y.

A. Representative images of expression of NLmiRs and NLGN4X, NLGN4Y (WT, S93P) in rat hippocampal neurons at DIV 13. Surface and intracellular NLGNs were labeled with anti-HA. B. Surface intensity level (means ± S.E.M.) normalized to NLGN4X. P values were calculated by one-way ANOVA Bonferroni’s multiple comparison test. (n=3). C. Experimental design for recording, and representative mEPSC traces recorded in cultured hippocampal neurons expressing NLmiRs or NLmiRs with NLGN4X, NLGN4Y (WT, S93P). D and E. mEPSC frequency cumulative probability and mean. P values were calculated by one-way ANOVA Bonferroni’s multiple comparison test. (n=3). F and G. mEPSC amplitude cumulative probability and mean. P values were calculated by one-way ANOVA with Bonferroni’s multiple comparison test. (n=3).
