
Figure 4. Cluster of ASD-associated mutations on NLGN4X surround the critical amino acid difference between NLGN4X and NLGN4Y.
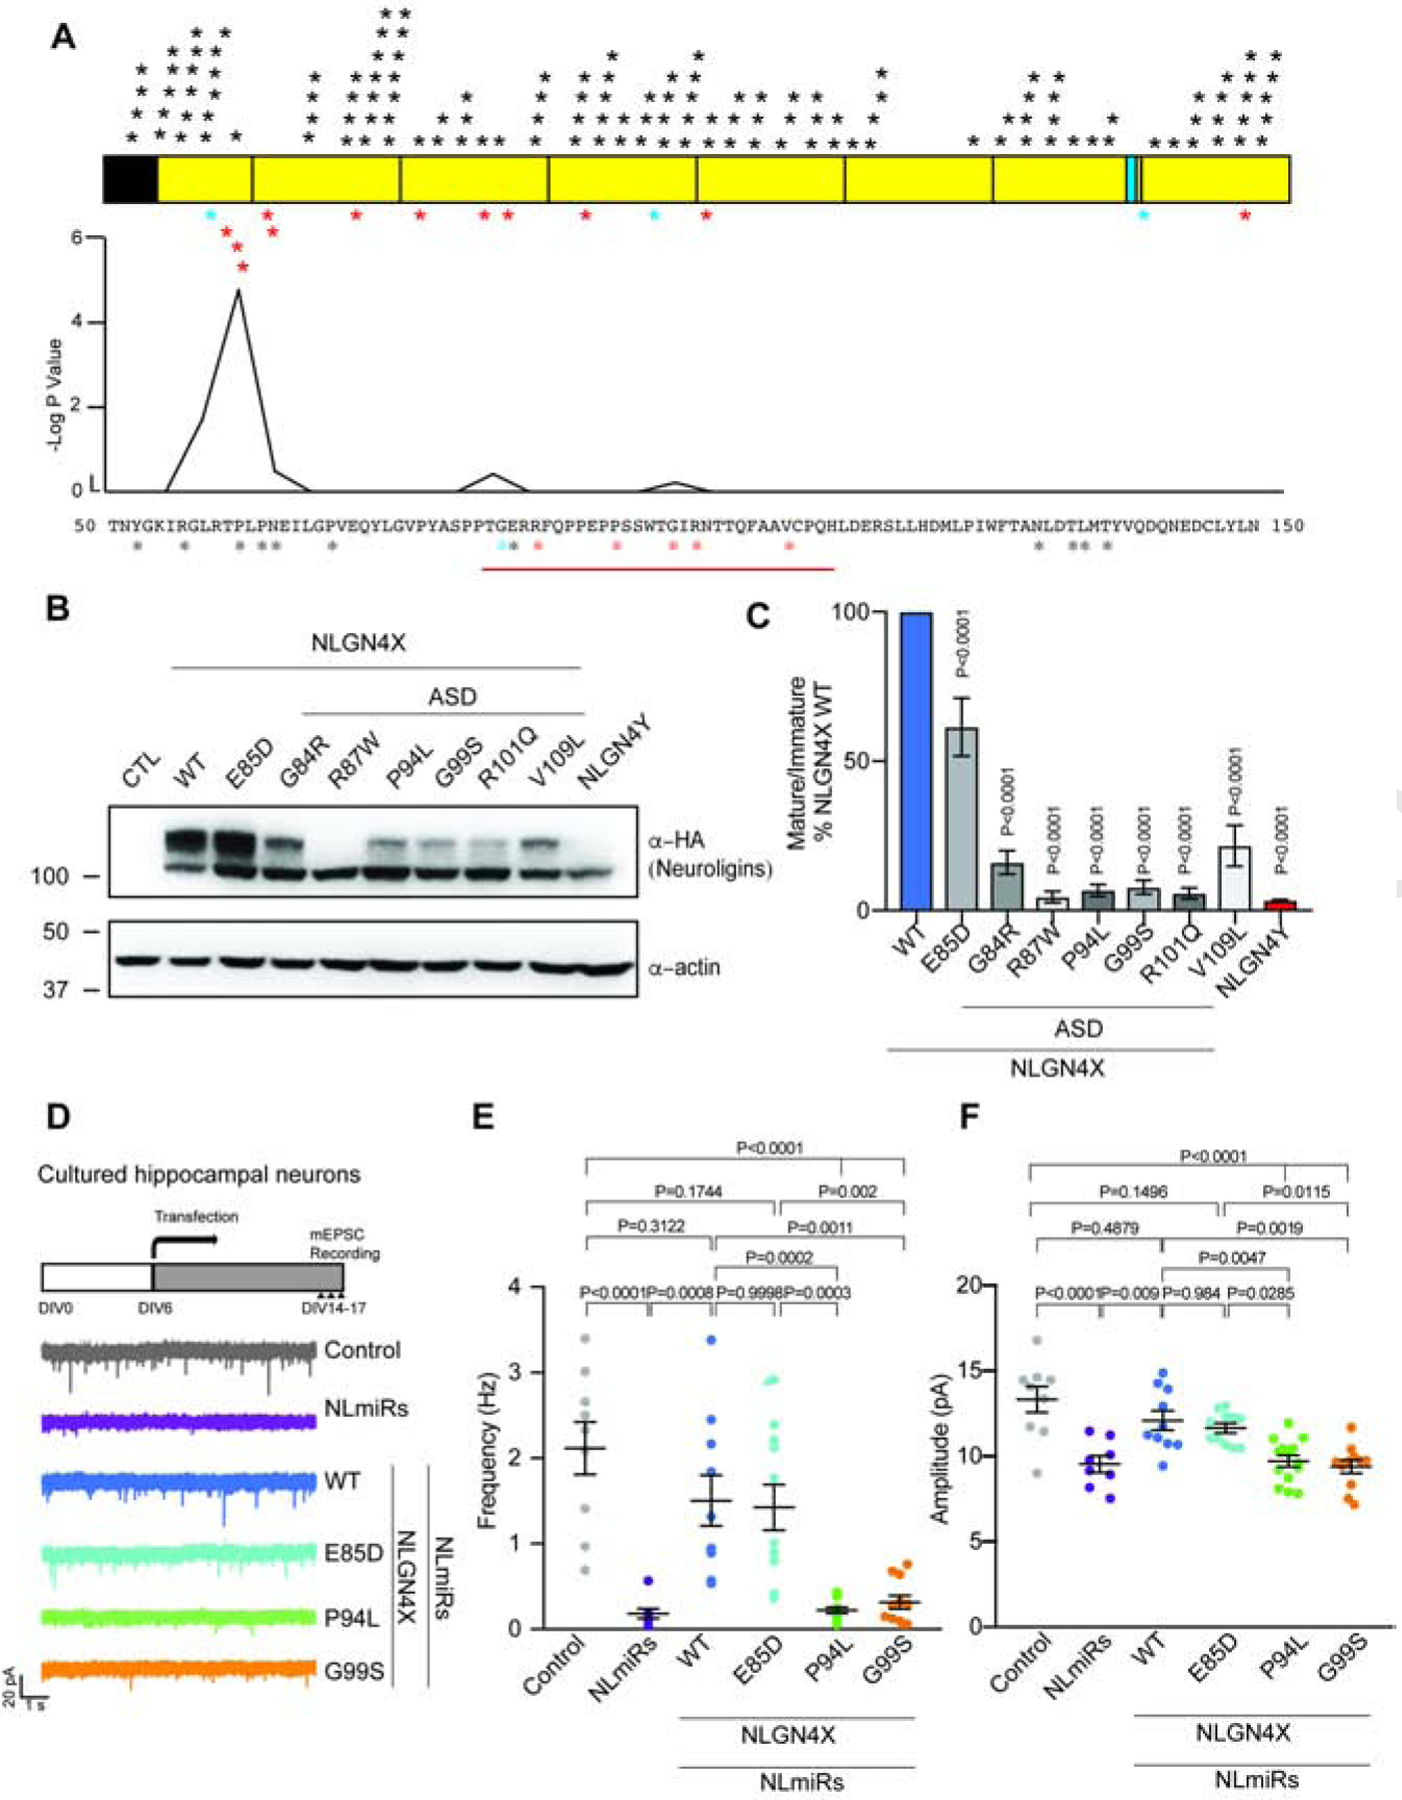
A. Schematic for NLGN4X showing mutations on NLGN4X. Black asterisks indicate variants in the normal population (gnomAD), blue asterisks indicate mutations in both normal population and ASD probands, and red asterisks indicate mutations in ASD and ID. Plot for -log p value from Fisher Exact Test to indicate the area surrounding NLGN4X P93 is significantly enriched in ASD-associated probands. B. Immunoblot of transfected NLGN4X WT, healthy population variant (E85D), and ASD-associated mutations (G84R, R87W, P94L, G99S, R101Q, and V109L). C. Ratio of mature/immature (means ± S.E.M.) normalized to NLGN4X WT. P values were calculated by one-way ANOVA with Bonferroni’s comparison test. (n=4). D. Experimental design for recording, and representative mEPSC traces recorded in cultured hippocampal neurons expressing NLmiRs or NLmiRs with NLGN4X (WT, E85D, P94L, G99S). E and F. Graph for the mean of mEPSC frequency and amplitude of cultured hippocampal neurons expressing NLmiRs or NLmiRs with NLGN4X (WT, E85D, P94L, or G99S). P values were calculated by one-way ANOVA Bonferroni’s multiple comparison test. (n=3)