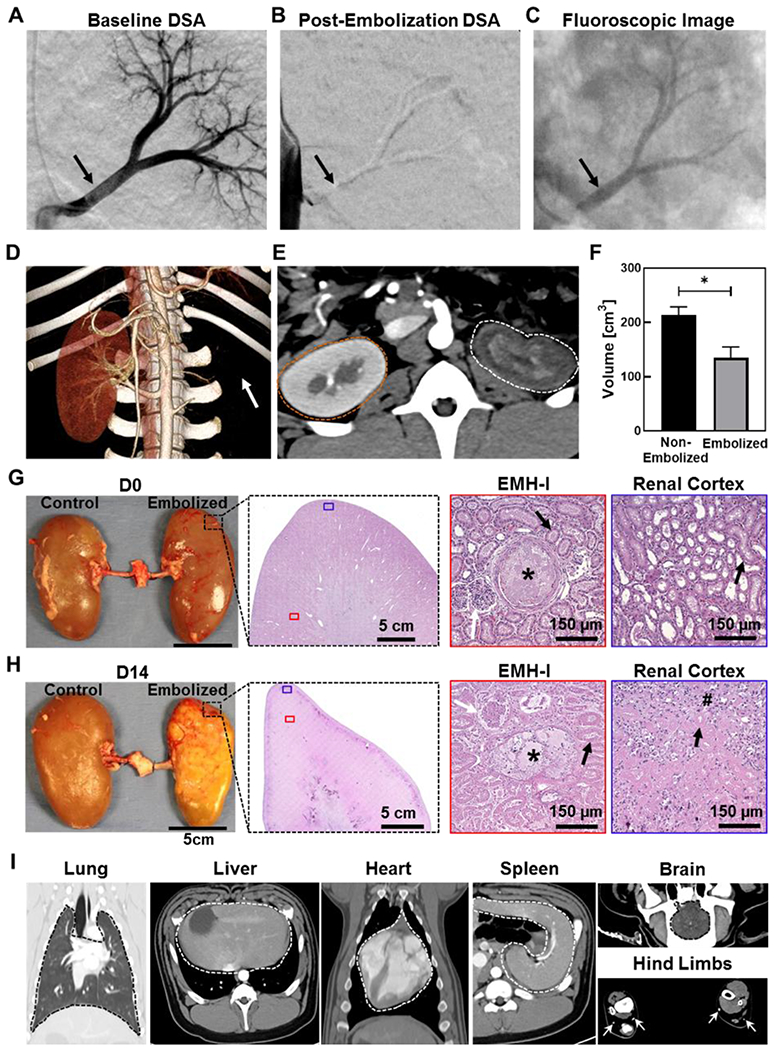
Figure 5.

Renal artery embolization in a porcine model using EMH-I. DSA of the left kidney (A) before (black arrow points to the patent main renal artery), and (B) after the delivery of EMH-I (black arrow points to the occluded main renal artery). EMH-I is not visible in (B) because radiodense structures (such as bones and EMH-I) are subtracted digitally from the image in DSA, allowing clear visualization of patent blood vessels. Since renal artery was occluded by EMH-I, it is not visualized on DSA. (C) Fluoroscopic image showing radiopaque EMH-I blocking the main renal artery as well as segmental arterial branches (black arrow) in kidney. (D) 3D CTA image of non-embolized and embolized kidneys 14 days post-procedure. Embolized kidney is missing (location denoted by white arrow) due to the absence of blood flow and non-enhancement. (E) Axial CTA image showing the non-enhancing parenchyma of the embolized kidney (white dotted outline) compared to the control (orange dotted outline). (F) Volume of embolized kidney and non-treated kidney as determined by CTA (n=4). (G, H) Gross image of excised kidneys, and representative H&E images of embolized kidney showing EMH-I (asterisks) in embolized vessels and the renal cortex at D0, and fibrosis (hash sign) with loss of architecture at D14. White arrows pointed towards granuloma and black arrows showed tubules. (I) CT images of normal organs in animals that received EMH-I. Lung, liver, spleen, heart, and brain are outlined by dotted line. White arrows point to widely patent vessels in hind limbs showing no evidence for non-target embolization. *p < 0.05. Each data point represents average ± standard error.
