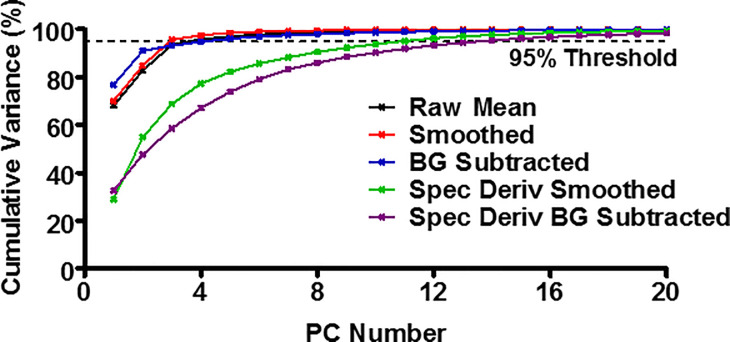
Fig 8. Principal Component Analysis (PCA) cumulative variance plots.
For the five different pre-processing data-types, the plot of the principal components (PC) against the cumulative variance is shown. Each data-type was represented by the PC number which incorporated >95% of the variance in the PCA and k-means study.

