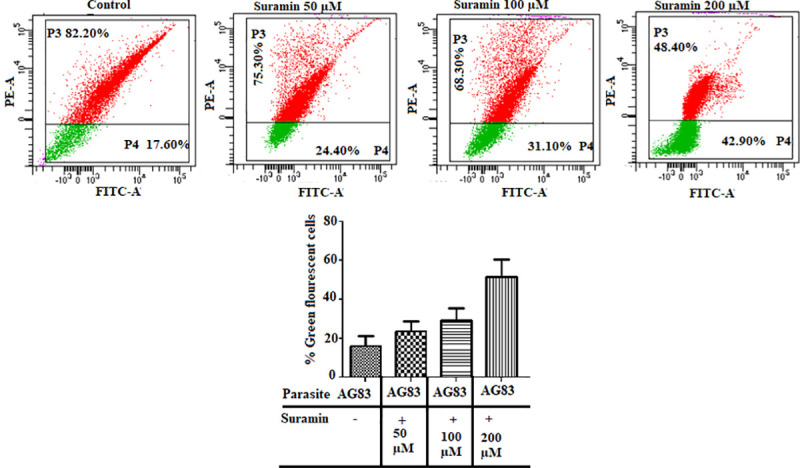
Fig 3. Effect of suramin on mitochondrial membrane potential (Δψm).

L. donovani promastigotes (AG83), untreated and treated with varying concentrations of suramin (50,100,200 μM) and stained with JC-1 were analyzed with flow cytometry on a BDLSR Fortessa analyzer with excitation wavelength at 488 nm and emission wavelengths 530 (green), 590 nm (red). The dot plots are representative of three independent experiments. The bar diagrams plot the percentage of green fluorescent cells as a function of suramin concentration given in the boxes below. The results show a dose dependent increase in green fluorescent cells with a loss in membrane potential thereby indicating the apoptotic pathway as the cause of drug induced cell mortality.
