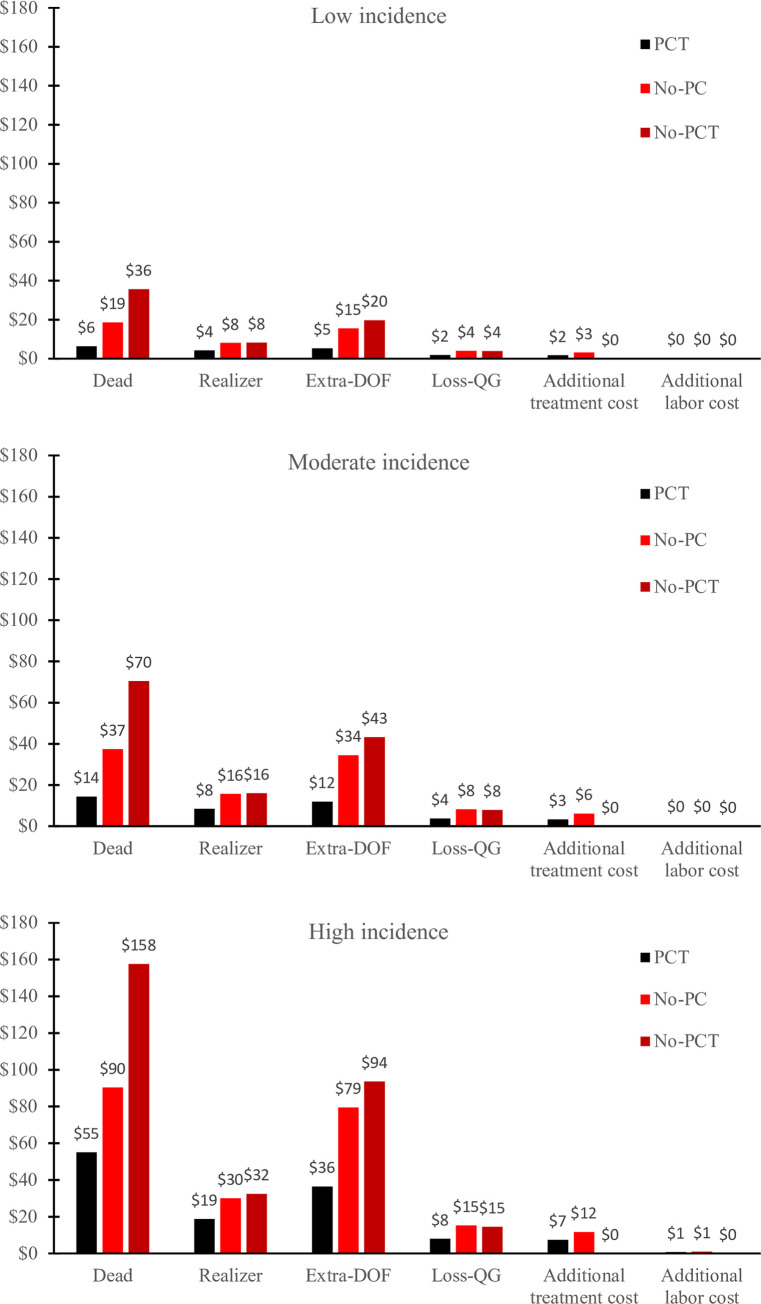
Fig 3. Additional mean costs and lost revenues per steer present in the feedlot at day 0, for the PCT, No-PC and No-PCT scenarios.
Mean estimates were used to parameterize the model for each level of incidence. PCT: Prevention Control and Treatment; No-PC: no Prevention, no Control; No-PCT: no Prevention, no Control and no Treatment; Extra-DOF: Additional Days On Feed; Loss-QG: Loss of Quality Grade.

