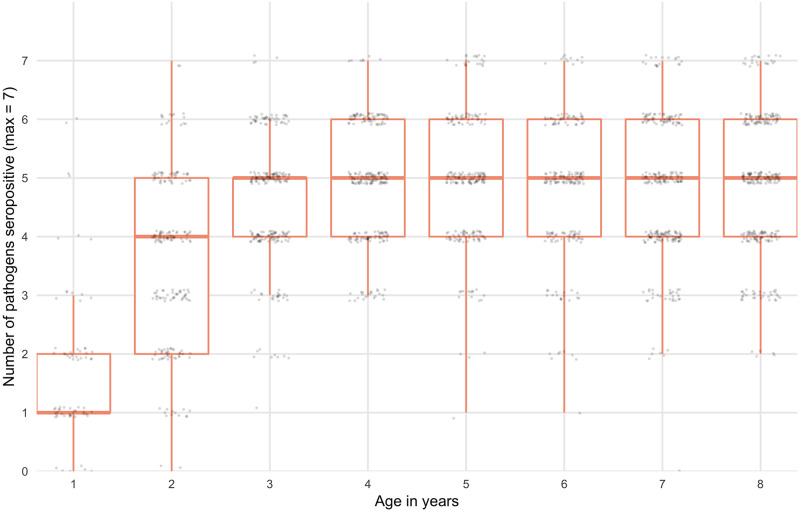
Fig 2. Seropositivity for more than 1 pathogen by age.
Boxplot depicts median, upper and lower quartiles. Seropositivity cutoffs were derived using ROC curves, if available, or by fitting finite mixture models (S1 Fig). IgG response measured in multiplex using median fluorescence intensity minus background (MFI-bg) on the Luminex platform on 2267 blood samples from 2267 children.

