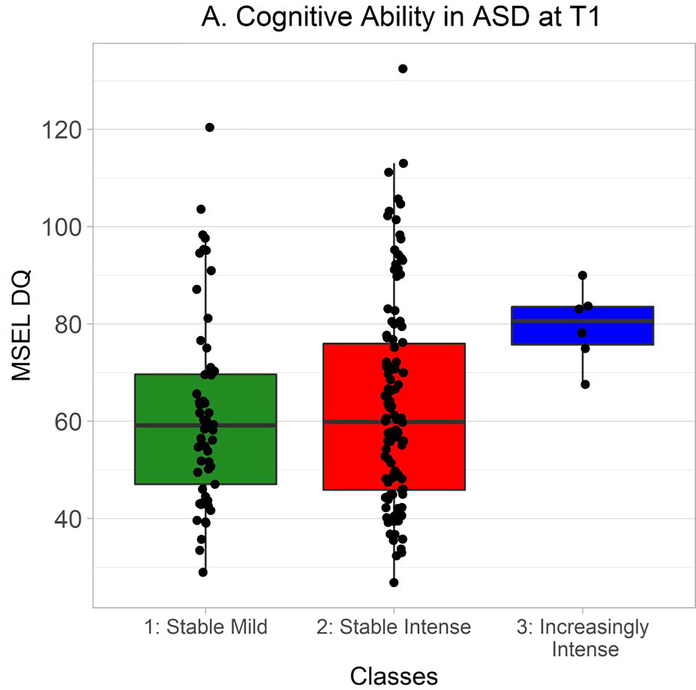
Figure 3A.
MSEL DQ at Time 1 in autistic participants from each class. Time 1 MSEL data were available from 57 autistic participants in the Stable Mild class, 114 in the Stable Intense class, and 6 in the Increasingly Intense class. Hinges correspond to first and third quartiles (25th and 75th percentiles) and whiskers extend 1.5x the interquartile range outwards from the hinges, or the range of the data (whichever is smaller).

