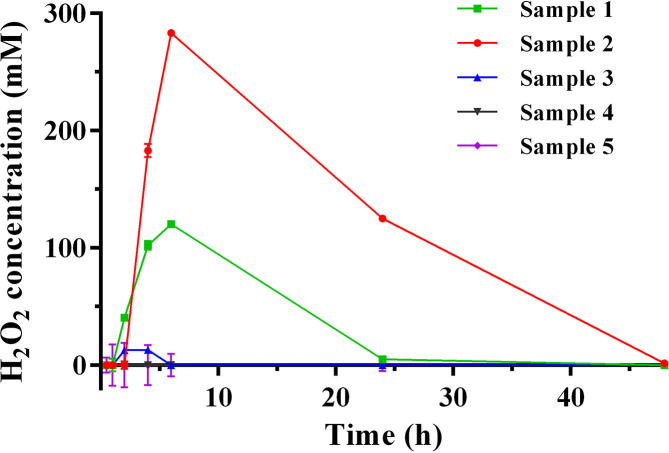
Fig. 4.
Time course for H2O2 production in five different freshly collected honey samples. Following dilution, the concentration of H2O2 in honey (25 % w/v) was assayed at various time points. Although collected at the same time and from the same region, the different samples varied substantially in H2O2 production levels. n=3, error bars show ±sd. Error bars ranged from 0.4 to 19 and were particularly small at the higher H2O2 concentrations, making these difficult to see.

