. 2020 Aug 25;9:e56196. doi: 10.7554/eLife.56196

Figure 2. Stereotypical maneuvers before and during flake consumption by one fish attracts its neighbors.

(A) An example of the stereotypical behavior of one fish (in a group of three) showing flake detection and consumption. Flake position is shown by a red circle before consumption and by a black circle after it has been eaten. (B–C) Stereotypical behaviors around flake consumption (denoted by time 0 and marked by a red dot) include a transient increase in speed (shown in body length (BL) per second), followed by a sharp decrease (in B); this is accompanied by an increase in the curvature of the trajectory (in C). Bold blue lines are mean speed and curvature profiles over all detection events of groups of three fish, and dotted green lines show a reference value calculated from random points along the trajectories not related to consumption events (curvature values were normalized such that the average curvature is zero). Light blue and green shadings show SEM. (D) Probability of neighbors to cross within 2 BLs from the location of a previous flake consumption, within 1–4 s following a consumption event, for one group of three fish (blue arrow), compared to the distribution of such neighbor crossing events, if flake consumption events were ignored (Materials and methods). This reference distribution of crossings is well fitted by a Gaussian distribution (mean = 0.25, SD = 0.056), which is shown by a overlaid black line. (E) Crossing probabilities for groups of three and six fish show significant increase from the baseline neighbor crossing distribution of each group, similar to C; 0 represent the mean of the baseline crossing distributions, error bars represent SEM.

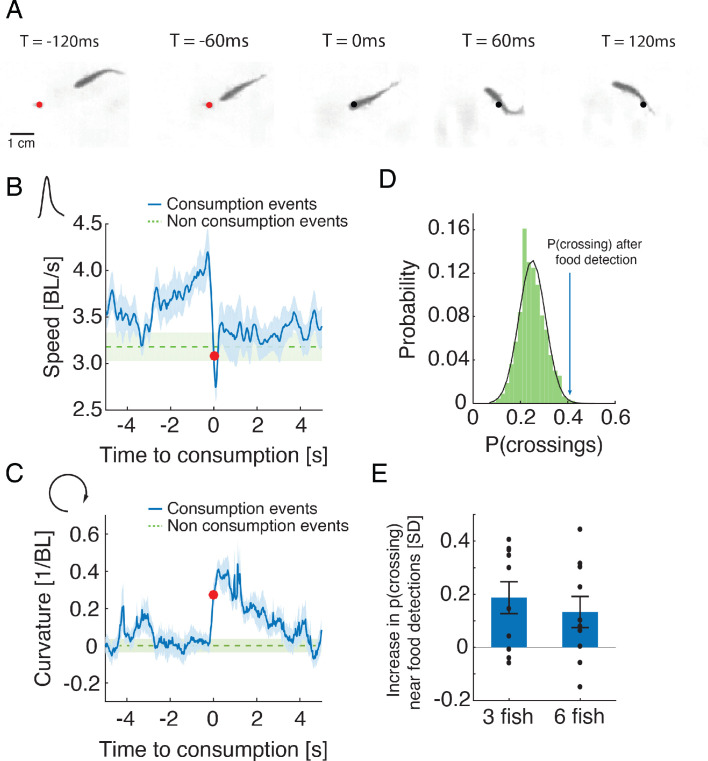
Figure 2.

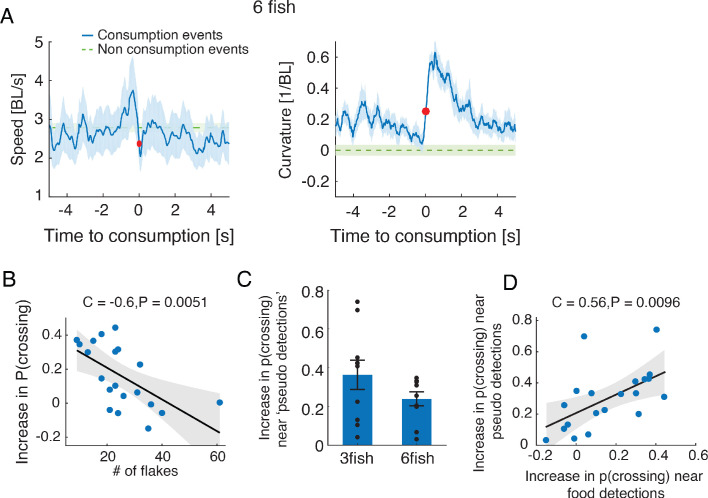
Figure 2—figure supplement 1. Stereotypical maneuvers before and during flake consumption by one fish attracts its neighbors.

Figure 2—figure supplement 1.

(A) Average speed and curvature near flake consumption of groups of six fish, similar to Figure 2B–C. (B) Increase of probability of fish to be attracted to the location of neighbors’ previous flake consumption decreased as flakes were more abundant in the arena. Pearson’s correlation coefficient, N = 20 (since no significant difference in this relationship was found between groups of three and six fish, both group sizes are included in the same analysis); The shaded area shows the 95% confidence interval of the linear regression model in black. (C) Fish showed a significant increase in tendency to swim towards neighbors when the latter changed their speed in a way that resembled flake consumption events (‘pseudo consumptions’)(p<0.005 for both group sizes, N = 10,10 for groups of three and six fish; Wilcoxon’s signed rank test). (D) The tendency to swim towards flake consumption events and pseudo consumptions was significantly correlated over groups, N = 20 groups (10 groups of three fish and 10 groups of six fish, no differences between group sizes); the shaded area shows the 95% confidence interval of the linear regression model in black.
Figure 2—video 1. Stereotypical maneuvers of fish during flake detection and consumption.
Download video file (505.1KB, mp4)
Zoom in on a single fish (swimming in a group of three fish) showing two consecutive events of flake detection and consumption. The fish speeds up toward the flake and turns sharply during consumption.