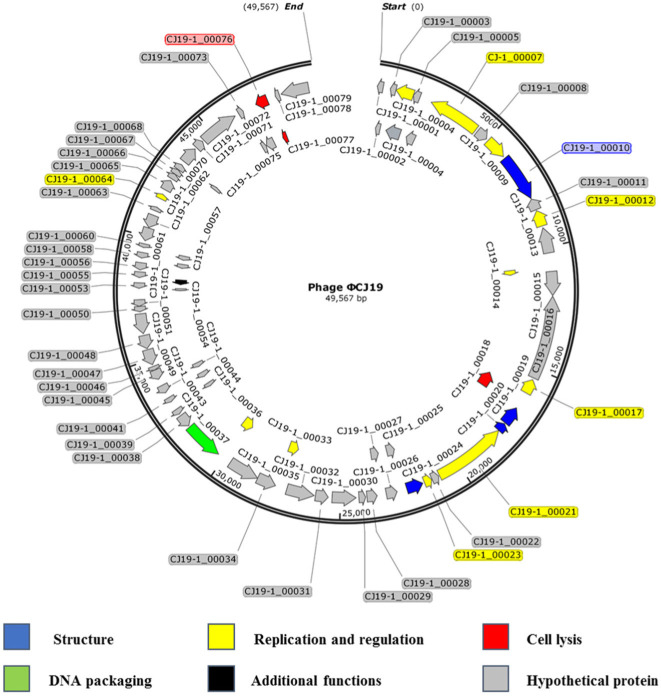
Fig. 3. Genome map of phage ØCJ19. The outer circle indicates the gene coding regions by strand.
The color of each gene refers to the functional category: phage structure (blue), replication and regulation (yellow), cell lysis (red), DNA packaging (green), additional functions (black), and hypothetical protein (gray). The scale units are base pairs. The genome map was constructed using the SNAPGENE software (GSL Biotech LLC, USA).

