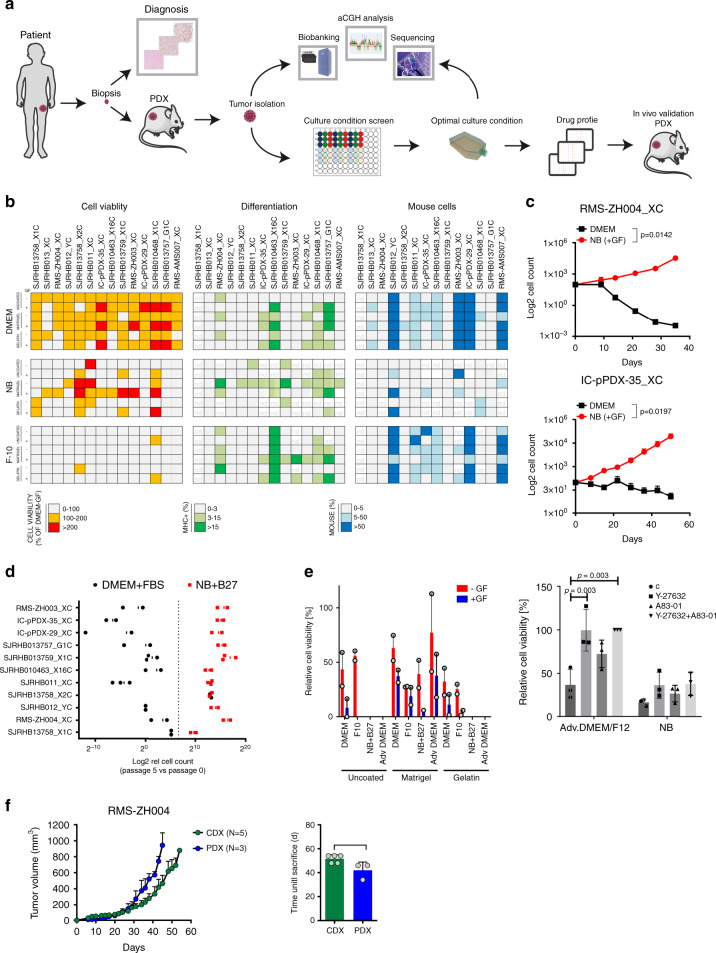
Fig. 1. 2D and 3D culture platform of PPCs.
a Workflow used to set up a RMS pre-clinical drug profiling platform. Briefly, PDXs were established from small RMS biopsies and first enzymatically dissociated to derive PPCs, followed by a culture condition screen (see text). DNA-sequencing and aCGH analysis were performed on both PDXs and paired PPCs to generate a sample collection with annotated genomic information. Finally, a high-throughput drug screen was conducted on each PPC cultivated under optimal culture conditions and top drug candidates were further validated in vivo on the original PDXs. b Culture optimization of indicated PPCs. Heat map depicting cell viability scores (n = 2–5 biological replicates), differentiation status (n = 2–3 biological replicates) and quantification of contamination with mouse stroma cells (n = 2–3 biological replicates) after short-term culture (1–3 weeks) of PPCs is shown. nd, not determined due to either low number of surviving cells or high fraction of cell loss during washing steps. c Growth curves of indicated PPCs cultured in DMEM on uncoated plates (black line) or in NB + GF on matrigel (red line). Cell number was normalized to day of seeding and is expressed in a log2 scale. (Mean ± range; n = 2 biological replicates). d Graph summarizing the proliferation rate of 11 PPCs under optimal and standard DMEM conditions. Data express the percentage of cells after 5 passages relative to day 0 in a log2 scale (n = 2–3 biological replicates). The dotted line indicates the cell number at day 0. e, left panel, Viability of the human cell fraction in PPCs from RMS-AMS007 PDXs cultured under indicated conditions (Mean ± range; n = 2 biological replicates). e, right panel, Viability of PPCs from RMS-AMS007 cultured in indicated media supplemented with ROCK- (Y-27632) and/or TGFβ- (A83-01) inhibitors (Mean ± sd; n = 3 biological replicates; two-way ANOVA with Tukey’s multiple comparisons test). f, left panel, Tumor growth kinetics of RMS-ZH004 PDX (blue, n = 3 biological replicates) and passage 4 CDX (green, n = 5 biological replicates). (Mean ± sem). f, right panel, Histogram indicating the day (d) of sacrifice of individual CDX- and PDX-bearing mice (gray dots) when tumors reached ~1000 mm3. (Mean ± sd; two-tailed paired t-test; NS, not significant;). Source data are provided as source data file.

