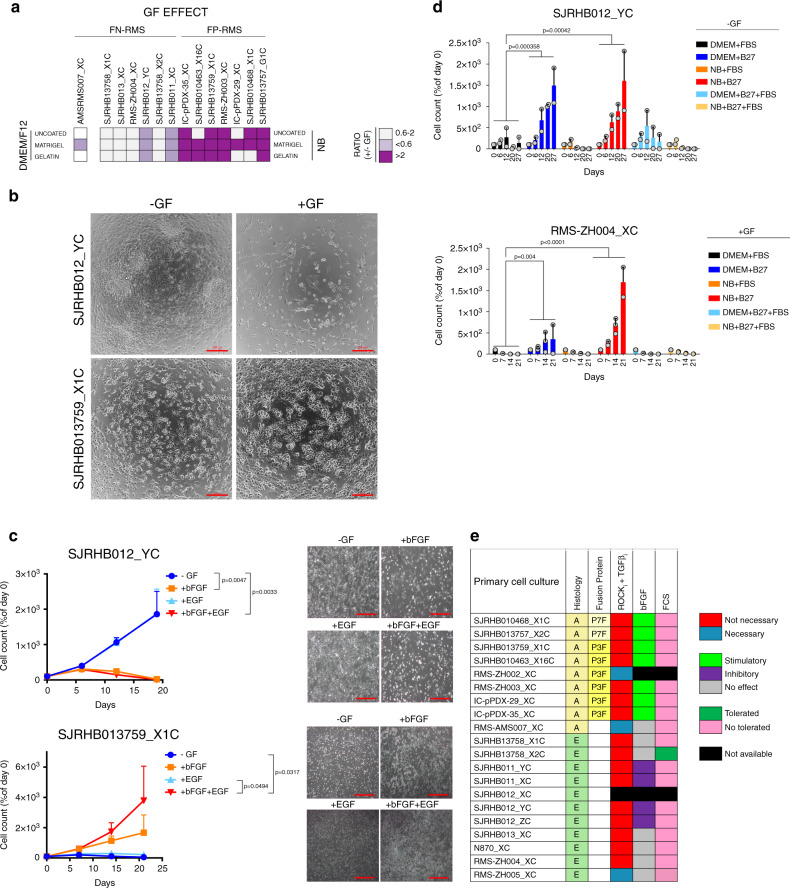
Fig. 2. Culture condition dependencies distinguish subgroups of RMS.
a Heat map displaying the ratio of cell viability scores (as calculated from data shown in Fig. 1b and corrected for mouse contamination) in presence and absence of GFs (+/- GF) for FN-RMS (left) and FP-RMS (right) PPCs. Light and dark purple colors indicate a negative and positive influence of the GF on cell viability, respectively. White color represents a range of negligible effect. b Representative bright-field images of indicated cells at passage 1 cultivated with or without GF stimulation. Scale bar, 200 μm. c Assessment of GF dependency for long-term proliferation of GF-inhibited (SJRHB012_YC, upper panel) and GF-stimulated (SJRHB013759_X1C, lower panel) cells. Each data point is expressed as percentage of day 0. (Mean ± range; n = 2 biological replicates; two-way ANOVA with Tukey’s multiple comparisons test). c, right panel, Representative light-microscopy images of the respective cells taken at passage 2. 100X magnification. d Histograms displaying cell counts over time for two PPC lines (RMS-ZH004_XC, SJRHB012_YC) cultivated under indicated conditions. -GF and +GF indicate the absence and presence of growth factors in the culture, respectively. (Mean ± range; RMS-ZH004_XC 0-14 days n = 3 biological replicates, RMS-ZH004_XC 21 days and SJRHB012_YC, n = 2 biological replicates; two-way ANOVA with Dunnett’s multiple comparison test). e Heat map summarizing growth conditions found to be optimal for indicated PPCs. NB, NB medium supplemented with 2xB27, Adv.DMEM/F12, Adv.DMEM/F12 medium supplemented with 0.75xB27, Y-27632, A83-01 and N-acetylcysteine. Source data are provided as source data file.

