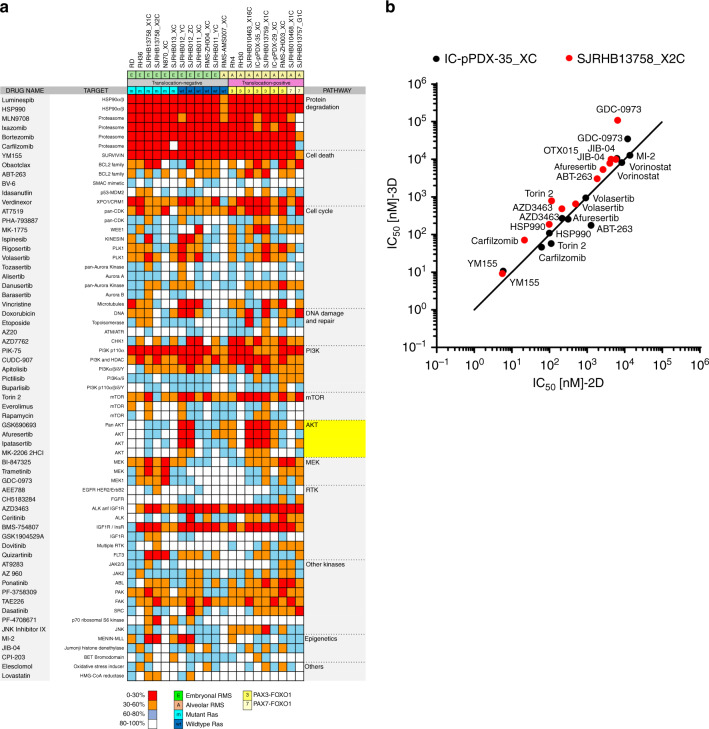
Fig. 4. 2D and 3D in vitro drug profiling of PPCs.
a Heat map depicting the activity of indicated agents used at a final concentration of 500 nM across the panel of RMS cells. Histological subtype, fusion status and RAS mutation status are shown above each column. Each color in the heat map indicates the percentage of remaining cell viability after treatment relative to vehicle control: 0–30% (red), 30–60% (orange), 60–79% (light blue) and >79% (white) (Mean; n = 2 biological replicates). b Correlation plot comparing IC50 values for indicated drugs determined in 2D and 3D cultures of IC-pPDX-35 and SJRHB13758_X2C cells. (Mean; n = 2–3 biological replicates). Source data are provided as source data file.

