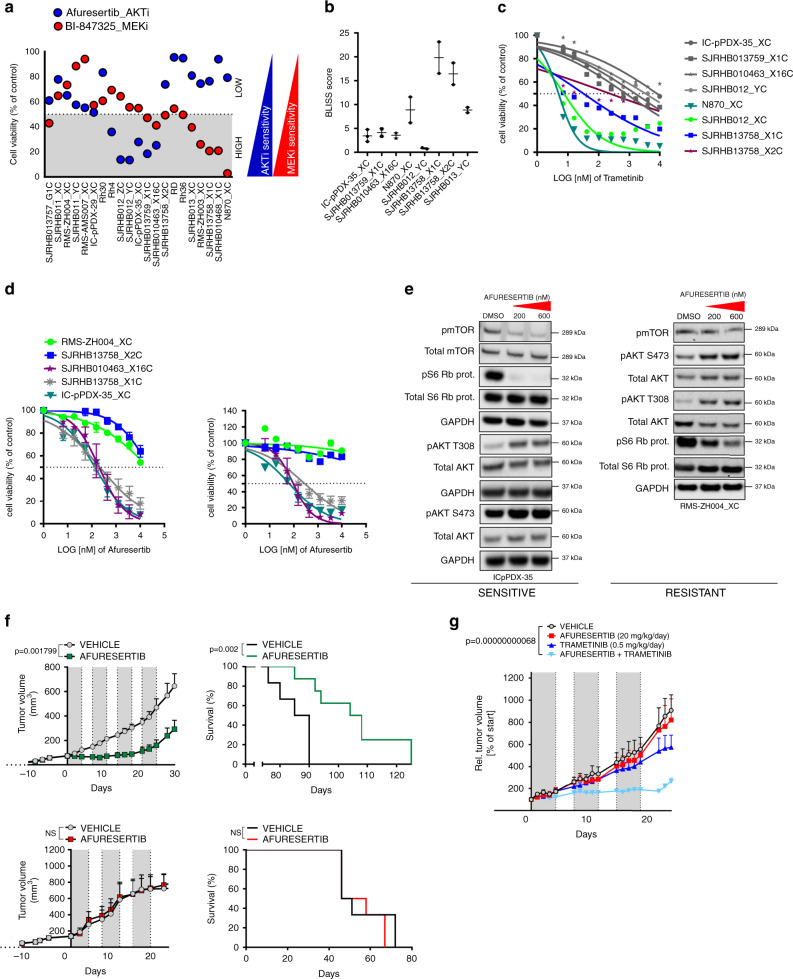
Fig. 6. In vitro and in vivo validation of afuresertib and trametinib for RMS treatment.
a Comparative analysis of afuresertib (AKTi, blue) and BI-847325 (MEKi, red) effects on cell viability. Data were computed from the drug screen experiments. Gray and white areas indicate the range below and above 50 percent inhibition of cell viability, respectively, which were chosen as range of high and low drug response (Mean; n = 2 biological replicates). b BLISS synergy scores from the combination treatment of indicated cells treated with a combination matrix of afuresertib and trametinib (Mean with range; n = 2 biological replicates). Scores were determined with the synergyfinder webtool. c Cell viability of indicated PPCs treated for 72 h with increasing concentrations of the MEK inhibitor trametinib. RAS mutant samples are depicted in colors, RAS wild type samples are in gray. (Mean; n = 2 biological replicates). d Cell viability of indicated PPCs treated for 72 h with increasing concentrations of the AKT inhibitors afuresertib (left panel) and GSK690693 (right panel). (RMS-ZH004_XC and IC-pPDX-35_XC, mean ± range, n = 2 biological replicates; SJRHB13758_X2C, SJRHB010463_X16C and SJRHB013759_X1C, mean ± sd, n = 3 biological replicates). e Western blot analysis showing expression and phosporylation status of indicated proteins from PPCs treated for 2.5 h with afuresertib at 200 nM and 600 nM or DMSO as control. Both an afuresertib-sensitive (IC-pPDX-35_XC) and -resistant (RMS-ZH004_XC) case is presented. GAPDH was used as loading control. The displayed blots are representative of n = 2 independent experiments. f, upper left panel Tumor growth of IC-pPDX-35 PDX (sensitive) treated with 100 mg/kg per day of afuresertib (green line) or vehicle control (black line). Gray color depicts treatment time frame (5 days) for four consecutive treatment cycles. (Mean ± sem; n = 6 mice; two-way ANOVA). d, Upper right panel, Kaplan–Mayer curves of mice from left panel. (Log rank (Mantel-Cox) test). f, Lower left panel, Tumor growth of RMS-ZH004 PDX (resistant) following the same treatment schedule as in the upper panel but for three consecutive cycles. (Mean ± sem; n = 6 mice; two-way ANOVA; NS, not significant). (Lower right panel) Survival curve of mice from left panel. (Log rank (Mantel-Cox) test; NS, not significant). g Tumor growth of IC-pPDX-35_XC PDX treated with vehicle controls (black line), 20 mg/kg per day of afuresertib (red line), 0.5 mg/kg per day of trametinib (dark blue line) or the combination of the two drugs (light blue line). Gray color depicts treatment time frame (5 days) for three consecutive treatment cycles. (Mean ± sem; control and afuresertib, n = 5 mice; trametinib, n = 4 mice; combination, n = 3 mice; two-way ANOVA with Tukey’s multiple comparisons test). Source data are provided as source data file.

