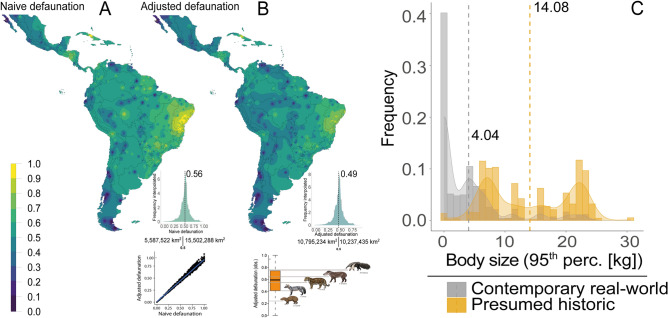
Figure 3.
(A) Overall distribution of pan-Neotropical naïve defaunation (inset shows the linear relationship between the naïve and adjusted defaunation) paired with the (B) Adjusted defaunation and observed adjusted defaunation and an example of ranked defaunation rates for some iconic mammal species (from bottom to top: Dasyprocta azarae, Cerdocyon thous, Panthera onca, Tapirus terrestris and Myrmecsophaga tridactyla); and (C) the distribution of assemblage-scale values of the 95th percentile of body mass in both historical and contemporary assemblages across the Neotropical realm represented by their respective distributions (vertical bars) and polynomial smoothed functions (curves). The maps were generated using R 3.5.352 (https://www.r-project.org/).

