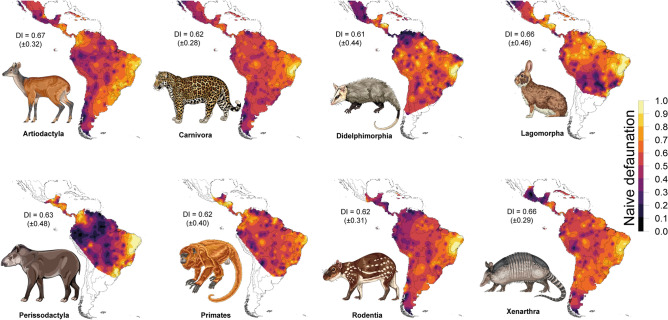
Figure 5.
Interpolation-based geographic distribution of the naïve defaunation index (DI) broken down by mammal orders across the Neotropics. Maps were pruned by the averaged limit of the distribution of any mammal species within each order via a convex-hull approach. The order Eulipotyphla is not shown because there is only one species (Solenodon cubanus) in the dataset. The maps were generated using R 3.5.352 (https://www.r-project.org/). Fernanda D. Abra (ViaFAUNA) kindly provided mammal species drawing used in the figure.

