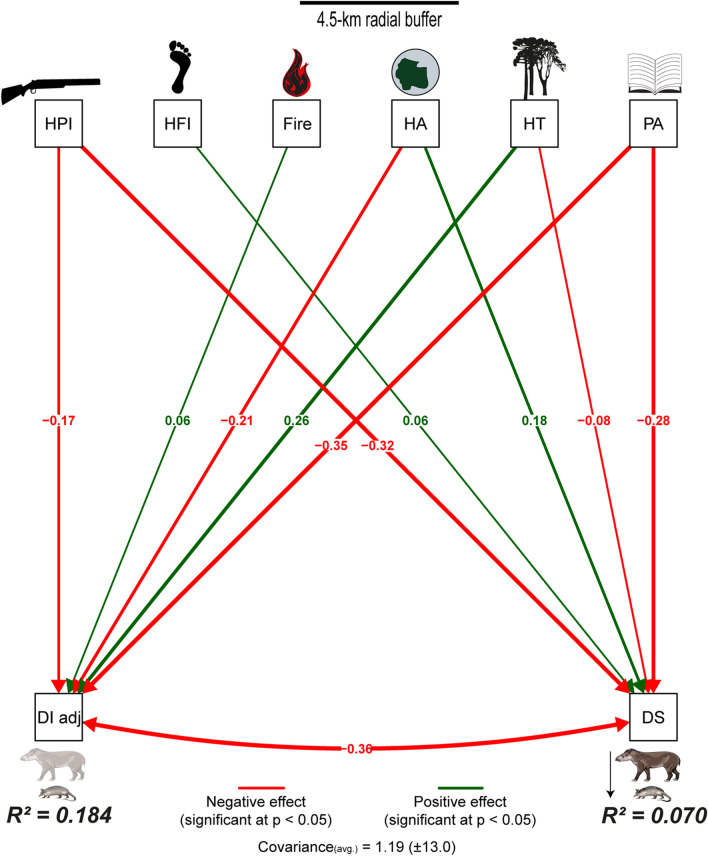
Figure 6.
Structural equation models (SEM: path analysis) to disentangle the linear cause-effect relationships between different environmental and demographic variables and either the adjusted defaunation (left arrows) and assemblage downsizing (right arrows) across 1,029 Neotropical sites. Green and red vectors represent positive and negative effects, respectively. Thicker vectors represent stronger effects. HPI, hunting pressure index; HFI, human footprint index; HA, habitat area; HT, habitat type; PA, protected area; DIadj., adjusted defaunation index; and DS, assemblage downsizing. Fernanda D. Abra (ViaFAUNA) kindly provided mammal species drawing used in the figure.

