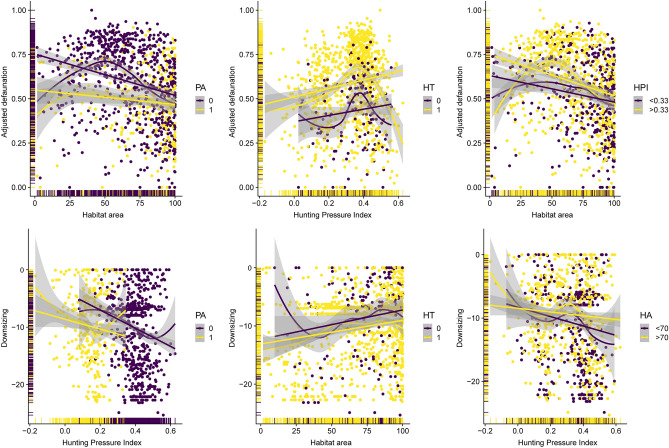
Figure 7.
Linear and non-linear scatterplots representing the main important bivariate relationships according to the structural equation models used to predict the adjusted defaunation (top panels) and assemblage downsizing (bottom panels) across 1,029 Neotropical mammal assemblages. Purple and yellow solid circles represent different classes in categorical variables or critical thresholds in continuous variables. PA, protected area (0 = no, 1 = yes); HT, habitat type (0 = open; 1 = forest); HPI, hunting pressure index; and HA, habitat area.

