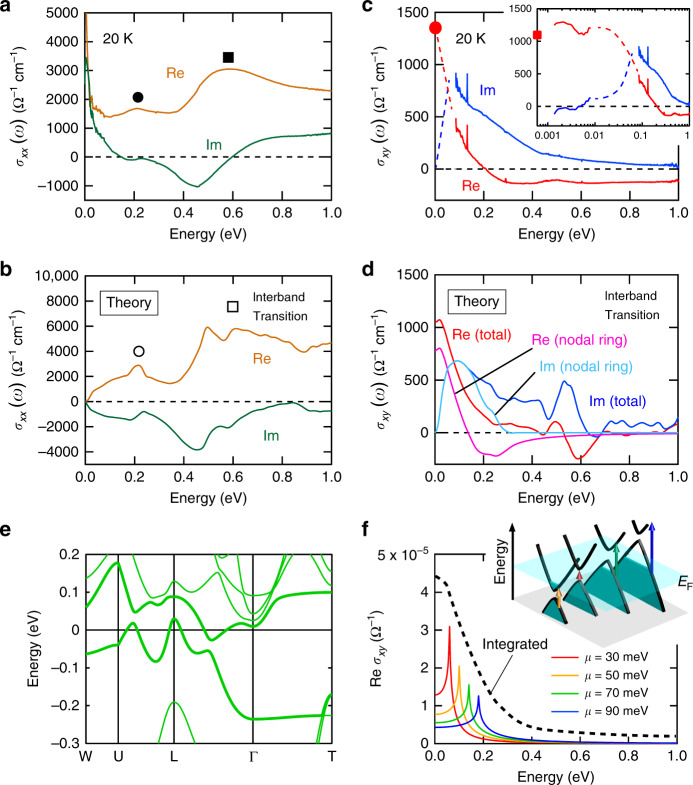
Fig. 3. Longitudinal optical conductivity and optical Hall conductivity spectra obtained from the experiment and first-principles calculation.
Experimental (a) longitudinal optical conductivity spectra σxx(ω) and (c) optical Hall conductivity spectra σxy(ω). The red circle at zero energy in c represents the DC value of the σxy of the bulk single crystal. The inset of c shows the optical Hall conductivity spectra including the terahertz spectra on the logarithmic energy scale. The red square at zero energy in the inset of c represents the DC value of the σxy of the thin film. The dashed lines in c for a photon energy region of 8–80 meV, where the MO measurements could not be done, represent the anticipated connections between the experimental σxy(ω) values in THz/DC and infrared regions, assuming that no sharp resonance structure is present in this narrow energy window. Theoretical (b) longitudinal optical conductivity spectra σxx(ω) and (d) Hall conductivity spectra σxy(ω) (see Method). In d, the red and blue curves represent the σxy(ω) spectra which take into account all band structures, while the pink and light blue ones show the σxy(ω) arising from the topological bands indicated by bold lines in e. These theoretical calculations include only the interband transition, so that the response from the intraband transition or Drude response of conduction electrons is omitted. e The band structure obtained from the calculation considering the renormalization factor. The two bands indicated by bold curves compose the anti-crossing lines and Weyl points. f Optical Hall conductivity σxy(ω) calculated for a single anti-crossing point in the two-dimensional electronic structure with mass gap m = 0.02 eV and chemical potential μ = 0.03 eV (red), 0.05 eV (orange), 0.07 eV (green), 0.09 eV (blue). The dotted line illustrates the schematic curve of the integrated sum of these resonances arising from the dispersive nodal ring. (Inset) Schematic illustration of the optical transitions on the cross-sections of the dispersive anti-crossing lines.

