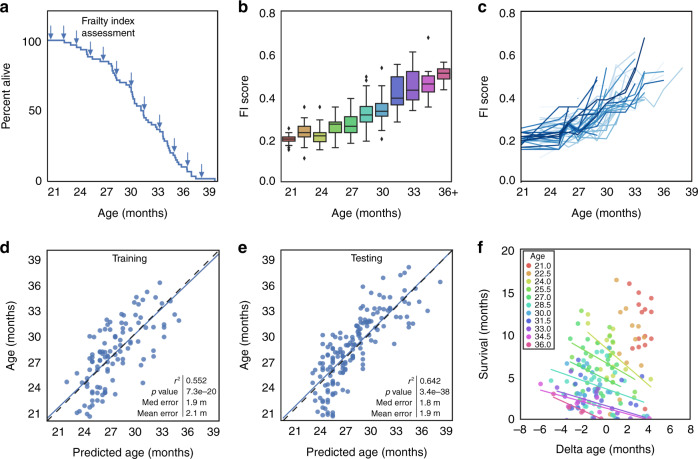
Fig. 1. Frailty correlates with and is predictive of age in mice.
a Kaplan–Meier survival curve for male C57BL/6 mice (n = 60) assessed longitudinally for Frailty Index (FI) (indicated by arrows). b Box and whisker plots displaying median FI scores for mice from 21 to 36 months of age. Colors indicate different ages (n = 24, 27, 20, 29, 43, 36, 32, 25, 18, 11, 6). Box plots represent median, lower and upper quartiles, and 95 percentile. c FI score trajectories for each individual mouse from 21 months until death. d Univariate regression of FI score for chronological age on a training dataset, and e a testing dataset. For training and testing datasets, data were randomly divided 50:50, separated by mouse rather than by assessment, n = 106 datapoints for training and n = 165 for testing. Correlation determined by Pearson correlation coefficients. f Residuals of the regression (delta age), plotted against survival for individual ages (as demonstrated by different colors). Regression lines are only graphed for ages where there is an r2 value >0.1. Source data are provided as a Source Data file.

