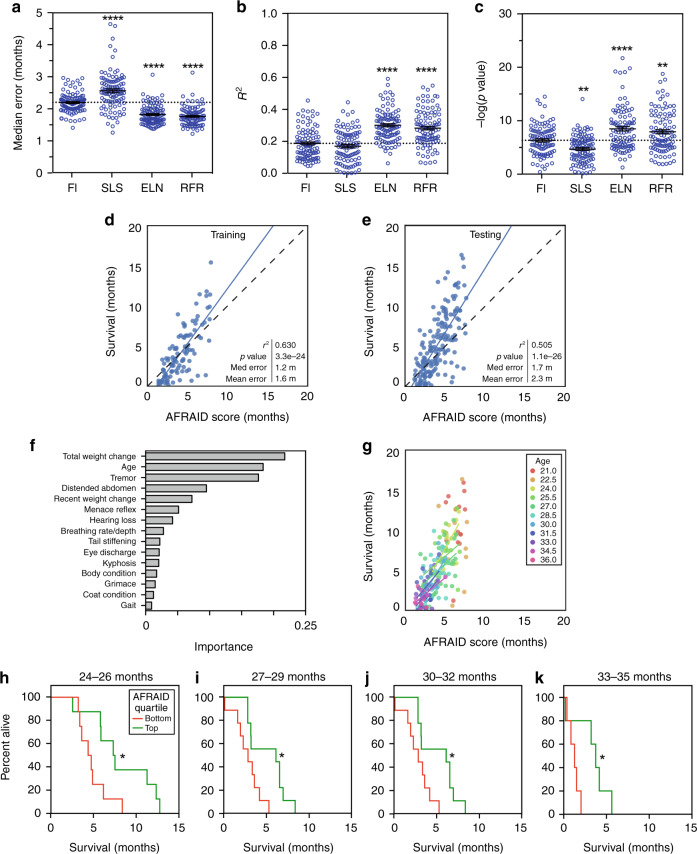
Fig. 4. Multivariate regressions of FI items to predict life expectancy (AFRAID clock).
a–c Median error, r2 values, and p values for univariate regression of Frailty Index (FI) score, and multivariate regressions of the individual FI items using either simple least squares (SLS), elastic net (ELN), or random forest regression (RFR) for life expectancy in the mouse training set. All models were tested with bootstrapping with replacement repeated 100 times, and each bootstrapping incidence is plotted as a separate point. ****p < 0.0001 and ***p < 0.001 compared to FI model with one-way ANOVA. Error bars represent standard error of the mean. d, e Random forest regression of the individual FI items for life expectancy on training and testing datasets (data was randomly divided 50:50, separated by mouse rather than by assessment, n = 106 datapoints for training and n = 165 for testing), plotted against actual survival. This model is termed the AFRAID (Analysis of Frailty and Death) clock. Correlation determined by Pearson correlation coefficients. f Importances of top 15 items included in the AFRAID clock. g AFRAID clock scores plotted against actual survival for individual mouse age groups (as demonstrated by different colors) in the testing dataset. Regression lines are only graphed for ages where there is an r2 value >0.1. h–k Kaplan–Meier curves of the bottom (red lines) and top (green lines) quartiles of AFRAID clock scores for mice over 1–2 assessments at 24–26, 27–29, 30–32, and 33–35 months of age. *p < 0.05 compared with two-sided log-rank test. Exact p values, respectively: 0.032, 0.015, 0.026, and 0.034. Source data are provided as a Source Data file.

