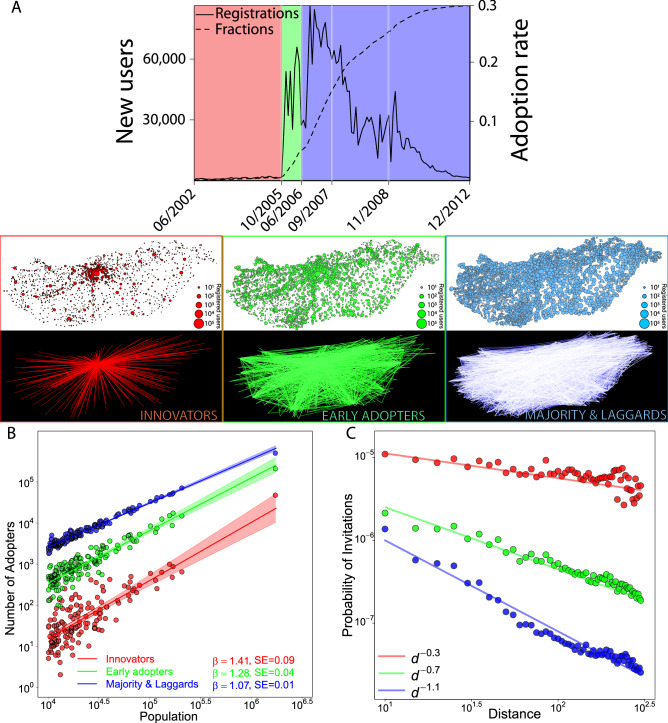
Figure 1.
Spatial diffusion over the OSN life-cycle. (A) Top: Number of new users and the cumulative fraction of registered individuals among total population over the OSN life-cycle. Users are categorized by the time of their registration into Rogers’s adopter types: (1) innovators: first 2.5%, (2) early adopters: next 13.5%, (3) early and late majority and laggards. White background maps: coloured dots depict towns; their size represent the number of adopters over the corresponding period. Black background maps: links depict the number of invitations sent between towns over the corresponding periods. (B) Adoption scales super-linearly with town population. The coefficient of urban scaling denotes very strong concentration of adoption in the Innovator stage and decreases gradually in later stages. Fitted lines explain the variation in Number of Adopters (log) by (red), (green), (blue). (C) The Probability of Invitations to distant locations is relatively high in the Inventors stage but decreased over the product life-cycle while diffusion became more local. Exponent fits explain the variation of Probability of Invitations (log) with (red line), (green line), (blue line).

