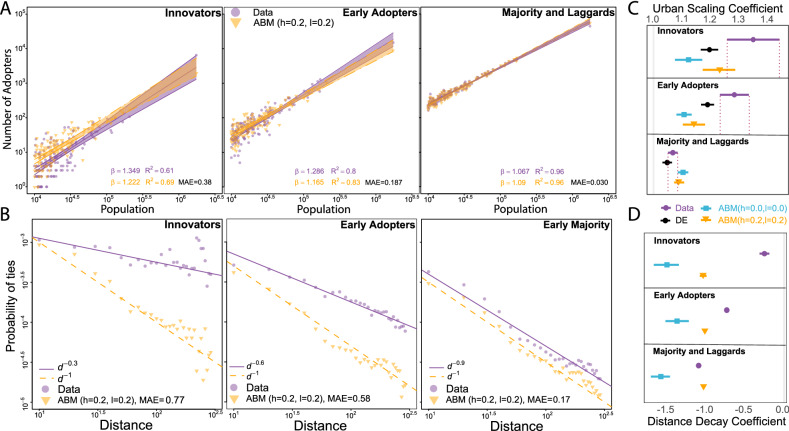
Figure 4.
Urban scaling and distance decay in the ABM. (A) Urban scaling of adoption in the ABM (h = 0.2, l = 0.2) and in the empirical data across the product life-cycle. Solid lines denote linear regression estimation and shaded areas are 95% confidence intervals. The ABM (h = 0.2, l = 0.2) significantly over-predicts the number of Innovators in small towns. Urban scaling in the Early Adopters phase is still smaller in the ABM (h = 0.2, l = 0.2) than in the empirical data. (B) The distance decay of social ties of Innovators and Early Adopters is larger in the ABM (h = 0.2, l = 0.2) than in reality and only becomes similar in the Early Majority phase. (C) Empirical urban scaling coefficients are declining over the life-cycle that is best captured by the ABM (h = 0.2, l = 0.2) prediction. Markers denote point estimates and horizontal lines denote standard errors. (D) Empirical distance decay coefficients are declining over the life-cycle that are not captured by the models. Markers denote point estimates and horizontal lines denote standard errors.

